Figure 10.

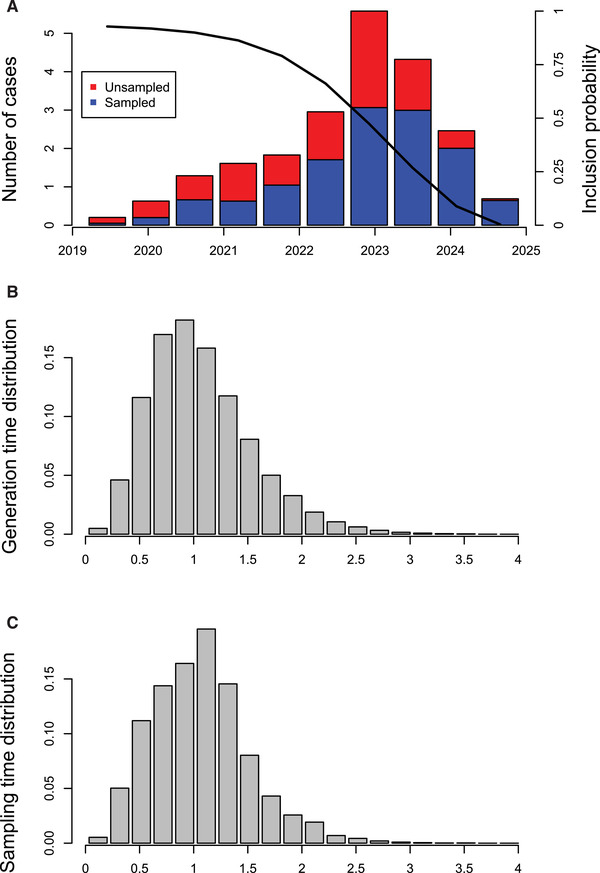
Number of cases in the transmission tree (A), realized generation time distribution (B), and realized sampling time distribution (C).

Number of cases in the transmission tree (A), realized generation time distribution (B), and realized sampling time distribution (C).