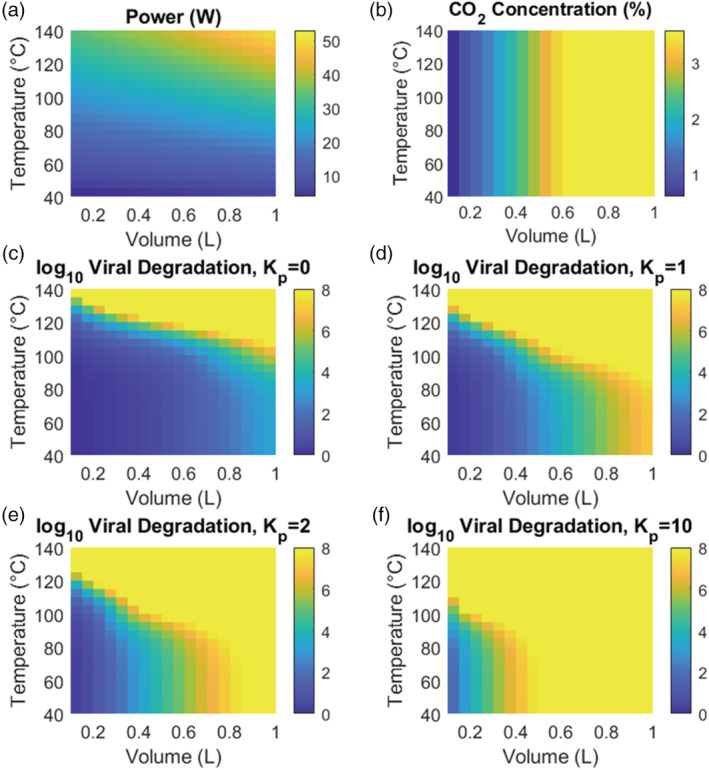
FIGURE 3.

(A) Required power at steady state as a function of mask volume and operating temperature. Power requirements range from 3.79 W for a 0.1 L mask at 40°C to 52.96 W for a 1 L mask at 140°C. (B) Inhaled CO2 concentration, averaged over a breath cycle. CO2 concentration increases with increasing mask volume but is invariant with operating temperature. (C–F) log10 viral inactivation as a function of mask volume and mean operating temperature. Results are plotted for several values of the partition coefficient, K p, which captures impedance of virus in the porous mask mesh, with K p = 0 indicating that virus is transported with the same velocity as air in the mask, while K p ≫ 1 indicates substantial slowing of viral particles relative to air [Color figure can be viewed at wileyonlinelibrary.com]
