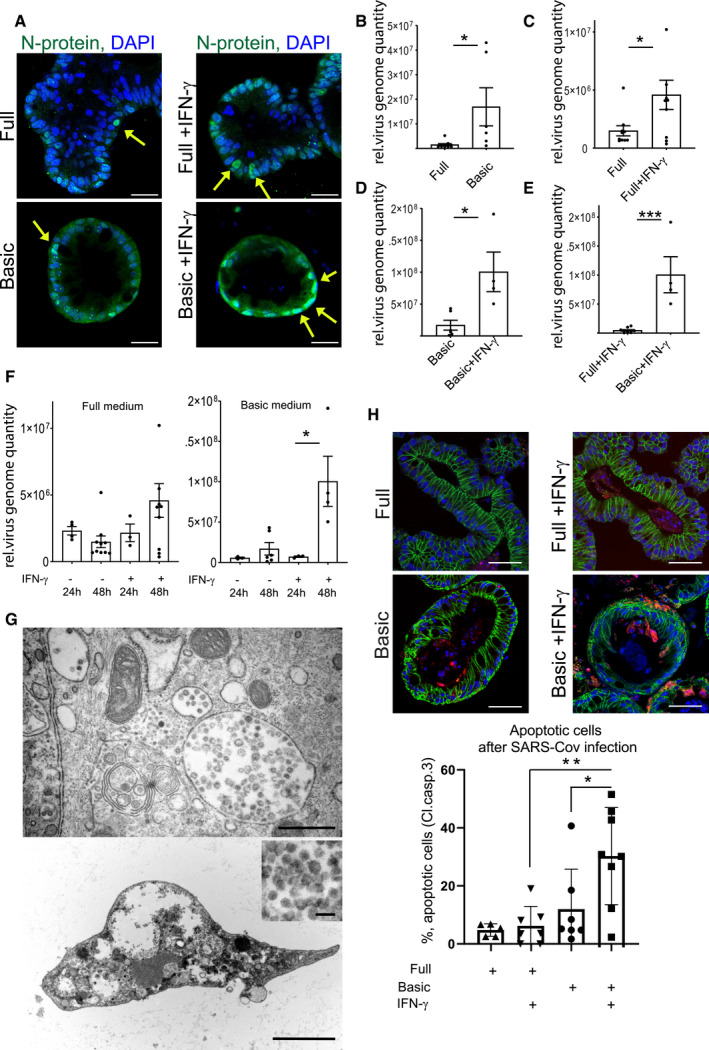
Figure 2. IFN‐γ increases infectivity of SARS‐CoV‐2 in colonic organoids.

-
AImmunofluorescence for N‐protein (green) 48 h after SARS‐CoV‐2 infection of human colon organoids cultured in full medium (upper), full medium + IFN‐γ (upper right), basic medium (lower left), and basic medium + IFN‐γ (lower right). Yellow arrows point to N‐protein‐positive cells. Scale bar: 25 µm.
-
BqPCR data displaying the relative virus load of SARS‐CoV‐2 measured by viral genome quantity in full medium vs. basic medium organoids 48 h after infection and normalized to GAPDH (n = 6). Data are presented as mean ± SD, *: P ≤ 0.05, **: P ≤ 0.001, ***: P ≤ 0.0001, as determined by Student’s t‐test (more details see Appendix Table S2).
-
CqPCR data displaying the relative virus load of SARS‐CoV‐2 measured by viral genome quantity in full medium vs. full medium + IFN‐γ‐treated organoids 48 h after infection and normalized to GAPDH (n = 9). Data are presented as mean ± SD, *: P ≤ 0.05, **: P ≤ 0.001, ***: P ≤ 0.0001, as determined by Student’s t‐test (more details see Appendix Table S2).
-
DqPCR data displaying the relative virus load of SARS‐CoV‐2 measured by viral genome quantity in basic medium vs. basic medium + IFN‐γ‐treated organoids 48 h after infection and normalized to GAPDH (n = 4). Data are presented as mean ± SD, *: P ≤ 0.05, **: P ≤ 0.001, ***: P ≤ 0.0001, as determined by Student’s t‐test (more details see Appendix Table S2).
-
EqPCR data displaying the relative virus load of SARS‐CoV‐2 measured by viral genome quantity in full medium + IFN‐γ vs. basic medium + IFN‐γ‐treated organoids 48 h after infection and normalized to GAPDH (n = 4). Data are presented as mean ± SD, *: P ≤ 0.05, **: P ≤ 0.001, ***: P ≤ 0.0001, as determined by Student’s t‐test (more details see Appendix Table S2).
-
FqPCR data comparing the relative virus load of SARS‐CoV‐2 measured by viral genome quantity normalized to GAPDH at 24 and 48 h after infection in full medium (left) and basic medium (right) untreated or treated with IFN‐γ, indicating increase in virus load in differentiated and IFN‐γ‐treated conditions (n = 8). Data are presented as mean ± SD, *: P ≤ 0.05, **: P ≤ 0.001, ***: P ≤ 0.0001, as determined by one‐way ANOVA, followed by Tukey's multiple comparisons test (more details see Appendix Table S2).
-
GElectron microscopy imaging of organoids grown in basic medium, pretreated with IFN‐γ for 3 days and infected for 48 h with SARS‐CoV‐2. Upper: Overview showing large virus‐loaded vesicles in an epithelial cell. Scale bar: 500 nm. Lower: Disintegrated organoid cell containing high virus load, scale bar: 2.5 µm, higher magnification to visualize virus particles, scale bar: 100 nm.
-
HImmunofluorescence for cleaved caspase‐3 (red) and E‐cadherin (green) 48 h after SARS‐CoV‐2 infection of human colon organoids cultured in full medium (upper), full medium + IFN‐γ (upper right), basic medium (lower left) and basic medium + IFN‐γ (lower right). Scale bar: 50 µm. (below) Quantification of apoptotic cells, indicating increased cell death in the differentiated and IFN‐γ‐treated condition after SARS‐CoV‐2 infection (n = 7). Data are presented as mean ± SD, *: P ≤ 0.05, **: P ≤ 0.001, ***: P ≤ 0.0001, as determined by one‐way ANOVA, followed by Tukey's multiple comparison test (more details see Appendix Table S2).
