
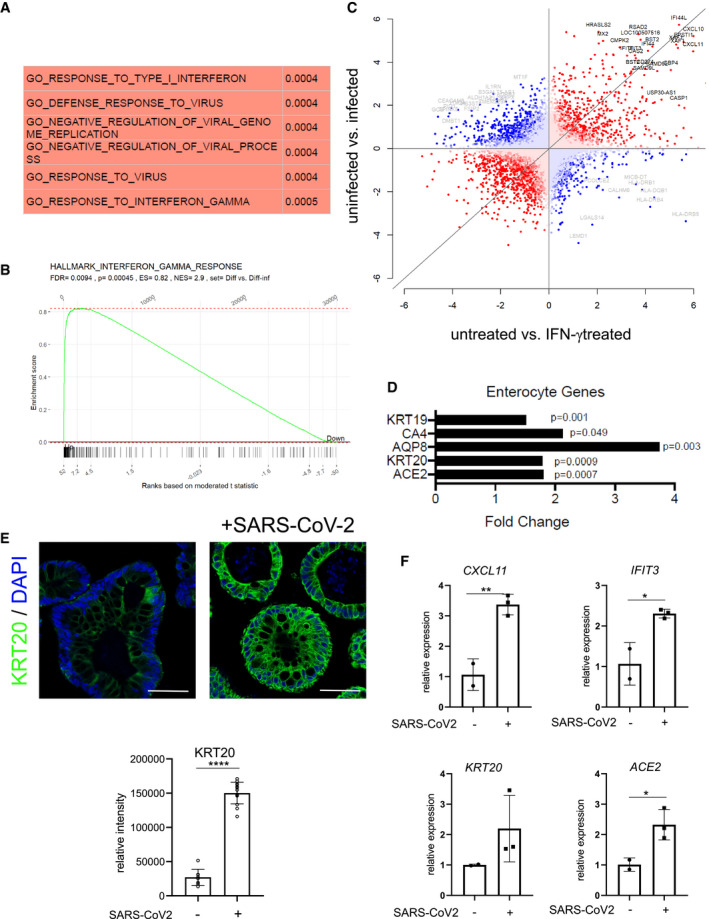
Figure 3. SARS‐CoV‐2 induces IFN‐γ gene expression signature and promotes differentiation.
-
AGene set enrichment analysis of the transcriptome data from uninfected vs. 48 h SARS‐CoV‐2 infected organoids was performed and the GO terms with the most significant positive correlation are displayed.
-
BGene set enrichment analysis of the transcriptome data comparing uninfected vs. 48 h SARS‐CoV‐2‐infected organoids and the “Hallmark interferon gamma response” gene set. P‐values were calculated using the fgsea package from https://www.bioconductor.org with 5,000 permutations.
-
CAnalysis of discordance and concordance of transcriptomic responses (DISCO) between untreated vs. SARS‐CoV‐2‐infected and untreated vs IFN‐γ‐treated organoids. The 50 most regulated genes are highlighted; gray: discordant and black: concordant.
-
DRelative expression of selected enterocyte‐specific genes upon SARS‐CoV‐2 infection, normalized to GAPDH. Differences in gene expression were assessed using the linear model ‘lmFit’ and ‘makeContrasts’ in limma.
-
EImmunofluorescence for KRT20 (green) in human colon organoids cultured in basic medium and either non‐infected (left) or 48 h after SARS‐CoV‐2 infection (right), indicating a strong increase in KRT20 expression after viral infection. Scale bar: 50 µm. Quantification of fluorescence intensity below (n = 8). Data are presented as mean ± SD, ****: P ≤ 0.0001, as determined by Student’s t‐test (more details see Appendix Table S2).
-
FqPCR data displaying the increase of INF‐γ target genes (CXCL11, IFIT3) (upper) and enterocyte marker genes (KRT20, ACE2) (lower) after SARS‐CoV‐2 infection, validating the results from the microarray analysis (n = 3). Data are presented as mean ± SD, ****: P ≤ 0.0001, as determined by Student’s t‐test (more details see Appendix Table S2).