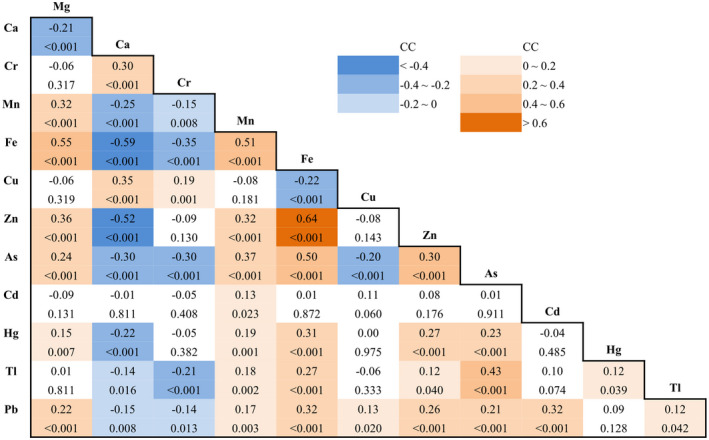
FIGURE 2.

Correlation matrix among the whole blood elements. Spearman correlation coefficients (CC, above) and P values (below, italic) for the spearman correlation between each two of the 12 elements. Green and blue color represent positively and negatively correlations, respectively. Correlation coefficients (CC, above) and P values (below). As, arsenic; Ca, calcium; Cd, cadmium; Cr, chromium; Cu, copper; Fe, iron; Hg, mercury; Mg, magnesium; Mn, manganese; Pb, lead; Tl, thallium; Zn, Zinc
