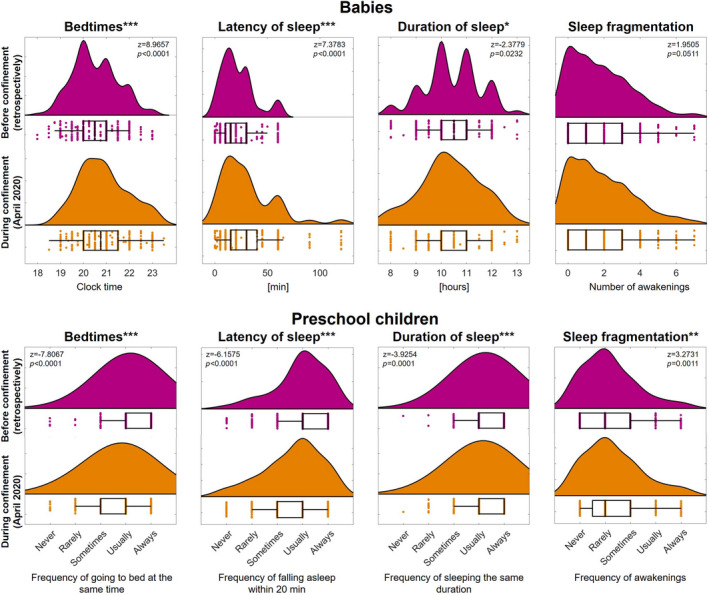
FIGURE 1.

Acute decrease in sleep quality in babies (0–35 months) and preschool children (36–71 months) as a consequence of the COVID‐19 confinement in April 2020. Raincloud plots indicate the distribution of core sleep quality measures (bedtimes, latency of sleep, duration of sleep and sleep fragmentation) before and during the confinement (452 babies and 412 preschool children). Dots represent individual subjects and box plots indicate the first and third quartiles (whisker length 1.5 * interquartile range; vertical lines represent the median). Statistics (z, p) are based on Wilcoxon signed‐rank tests (before versus during the confinement). Data were collected with age‐specific assessments: Brief Infant Sleep Questionnaire (BISQ) for babies and Children's Sleep Habits Questionnaire for preschool children. Consequently, we note the quantification of absolute values for babies and reports of frequency of occurrence for preschool children. The significance levels are indicated as *p < 0.05, **p < 0.01 and ***p < 0.001 after correcting for multiple testing by means of the false discovery rate. This figure was based on Blume et al. (2020) for the purpose of comparability
