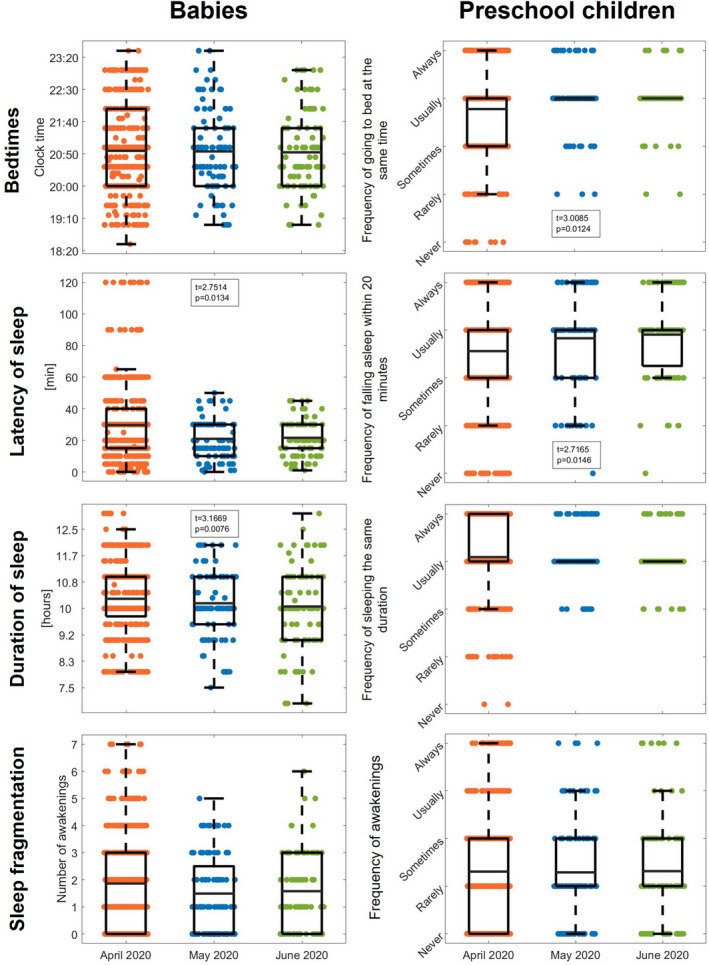
FIGURE 2.

Evolution of sleep variables across the COVID‐19 confinement period from April to June 2020 in babies (0–35 months) and preschool children (36–71 months). Box plots, indicating the first and third quartiles as well as the mean (whisker length 1.5 * interquartile range), and scattered dots display core sleep measures (bedtimes, latency of sleep, duration of sleep and sleep fragmentation) for baseline assessment (April 2020; in orange; 452 babies and 412 preschool children), first follow‐up (May 2020; in blue; 96 babies and 100 preschool children) and second follow‐up (June 2020; in green; 90 babies and 95 preschool children). t‐ and p‐values depict significant time effects from our linear mixed model after correcting for multiple comparisons by means of the false discovery rate. Due to age‐specific assessment tools, absolute values are presented for babies and reports of frequency of occurrence for preschool children
