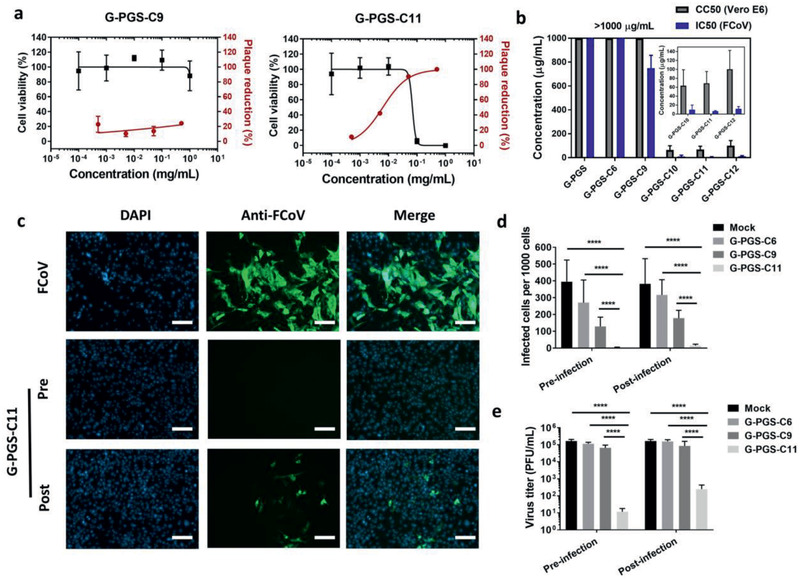
Figure 2.

a) Cell viability versus plaque reduction (FCoV) curves of the functionalized graphene platforms at different concentrations. b) Comparison between CC50 (Vero E6 cells) with the IC50 (FCoV) values for the compounds. c) Immunofluorescent images for the FCoV‐infected cells in the presence of G‐PGS, G‐PGS‐C9 and G‐PGS‐C11 at 10 µg mL−1. Scale bar: 100 µm. The images for other compounds are shown in the Supporting Information. d) Counting of infected cells by FCoV in the presence of G‐PGS, G‐PGS‐C9, and G‐PGS‐C11 at 100 µg mL−1. e) Titration of virions in the medium from the pre‐ and post‐infection studies. Values are expressed as mean ± SD, n = 4. ****p < 0.001 from student's t‐test.
