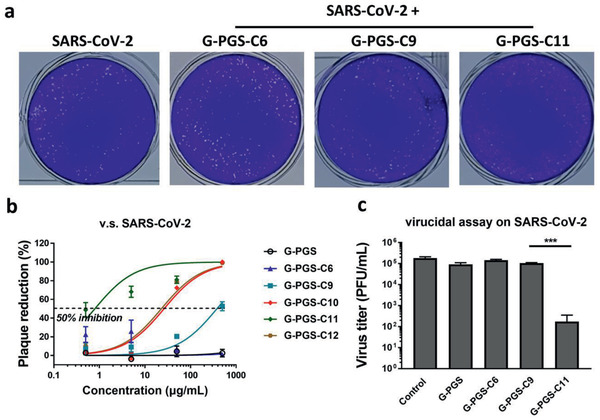
Figure 4.

a) Typical plaque images for SARS‐CoV‐2 treated by the functionalized graphene platforms at 50 µg mL−1. b) Plaque reduction curves for SARS‐CoV‐2 in the presence of the functionalized graphene platforms at different concentrations. c) Virucidal assay for the functionalized graphene platforms. Values are expressed as mean ± SD, n = 4.
