
FIGURE 2.
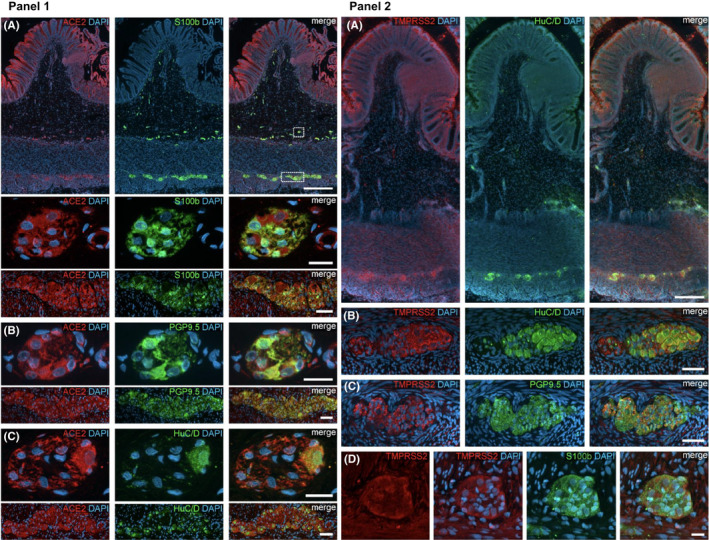
Panel 1: ACE2 expression in the human ENS of the large intestine. (A) Overview of the entire gut wall of a colon segment with immunofluorescence stainings for ACE2 (red), the glial marker S100b (green), and with the nuclear marker DAPI (blue). The white rectangles indicate the location of the high‐power magnification micrographs below showing a representative submucous and myenteric ganglion. (B, C) Show representative submucous and myenteric ganglia stained for ACE2 (red), DAPI (blue), and the neuronal markers PGP9.5 (B, red) or HuC/D (C, red). The ACE2 staining can be found in neurons and glial cells and is considerably stronger in the colon compared to the small intestine. The overview is a standard epifluorescence image; details are maximum intensity projections of optical sections by structured illumination. Scale bars: overview 250 mm; details 50 mm. Panel 2: TMPRSS2 expression in the human ENS. (A) Overview of the entire gut wall of a colon segment with immunofluorescence stainings for TMPRSS2 (red), the neuronal marker HuC/D (green), and the nuclear marker DAPI (blue). (B, C) Show representative large intestinal myenteric ganglia stained for TMPRSS2 (red), DAPI (blue), and the neuronal markers HuC/D (B, red) or PGP9.5 (C, red). (D) Representative myenteric ganglion in the small intestine stained for TMPRSS2 (red), the glial marker S100b (green), and the nuclear marker DAPI (blue). Note that TMPRSS2 stainings were markedly stronger in enteric ganglia in the colon (A–C) than in the small intestine (D). The overview is a standard epifluorescence image; details are maximum intensity projections of optical sections by structured illumination. Scale bars: (A) 250 mm; (B–D) 50 mm. Figure adapted with permission from Deffner F et al. Front Neuroanat 2020; 14:596439; Copyright © 2020 Deffner, Scharr, Klingenstein, Klingenstein, Milazzo, Scherer, Wagner, Hirt, Mack and Neckel