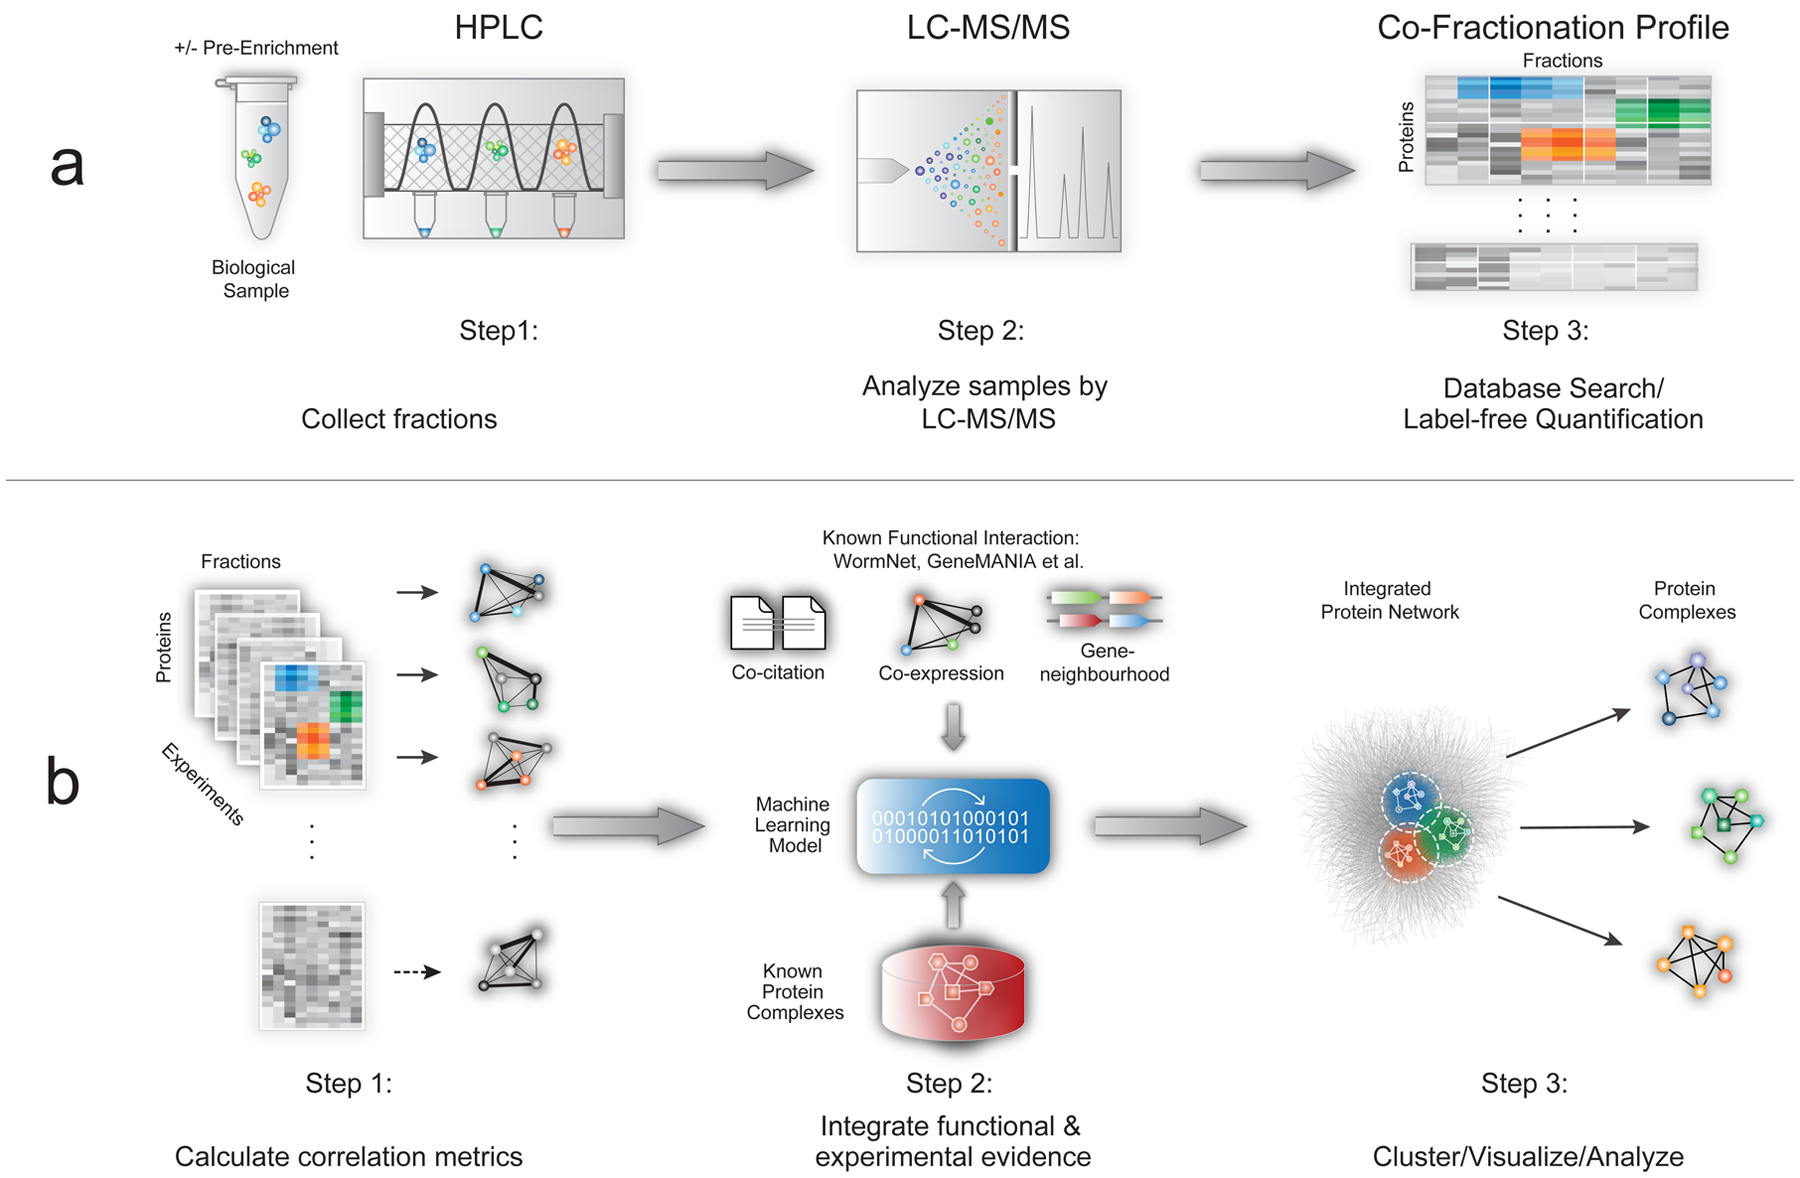
Figure 1: EPIC workflow.

a) CF/MS experiments have three main steps: biochemical fractionation, MS analysis, and protein profile scoring. b) Automated computational analysis using EPIC takes CF/MS data as input and consists of three main steps: (i) calculation of co-elution profile similarity using correlation metrics; (ii) co-complex PPI scoring using machine learning-based integration of experimental and functional evidence; (iii) prediction, clustering, and benchmarking of derived complexes.
