FIGURE 5.

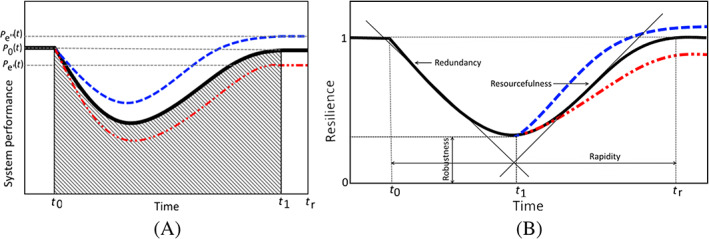
Graphical illustration of resilience: (a) system performance; (b) resilience. Black line shows full recovery to prehazard system performance. Red line shows partial recovery. Blue line shows improved system performance

Graphical illustration of resilience: (a) system performance; (b) resilience. Black line shows full recovery to prehazard system performance. Red line shows partial recovery. Blue line shows improved system performance