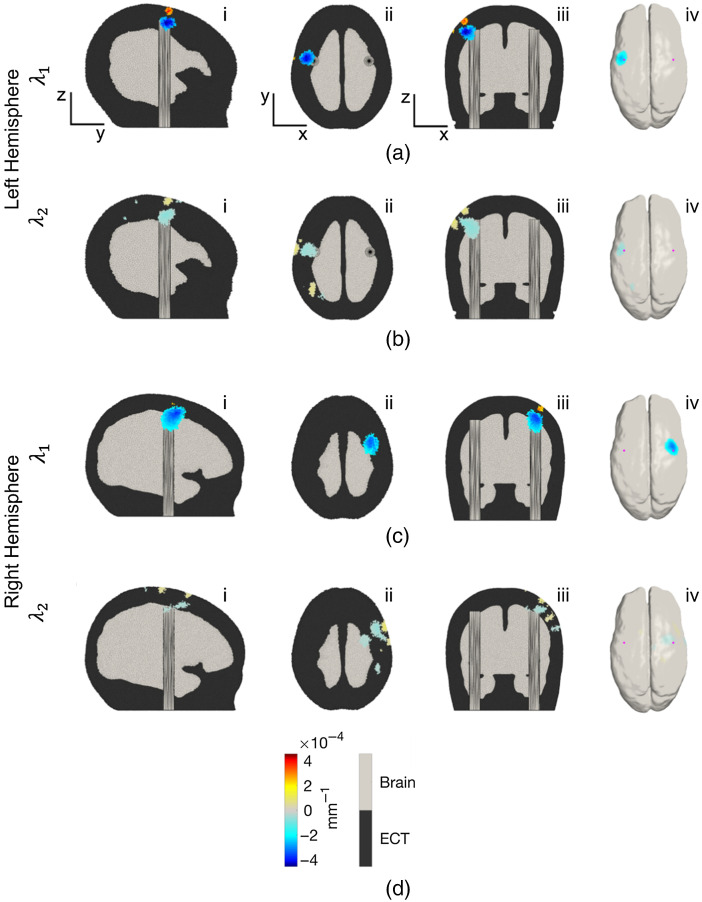
Fig. 12.
Volumetric and GM -surface images of the change in absorption coefficient at 735 nm () and 850 nm () displayed for (a), (b) the left and (c), (d) the right hemisphere activations. Images are an average of a time window of between 190- and 210-s post-activation onset, and reconstructed relative to the mean of the 20-s pre-activation. Each image is thresholded at 50% of the maximum absolute signal deviation found in the volume. The sub-panels in each row show the volume images in (i) sagittal section, (ii) transverse section, and (iii) coronal section, and (iv) an extraction of the GM surface.

