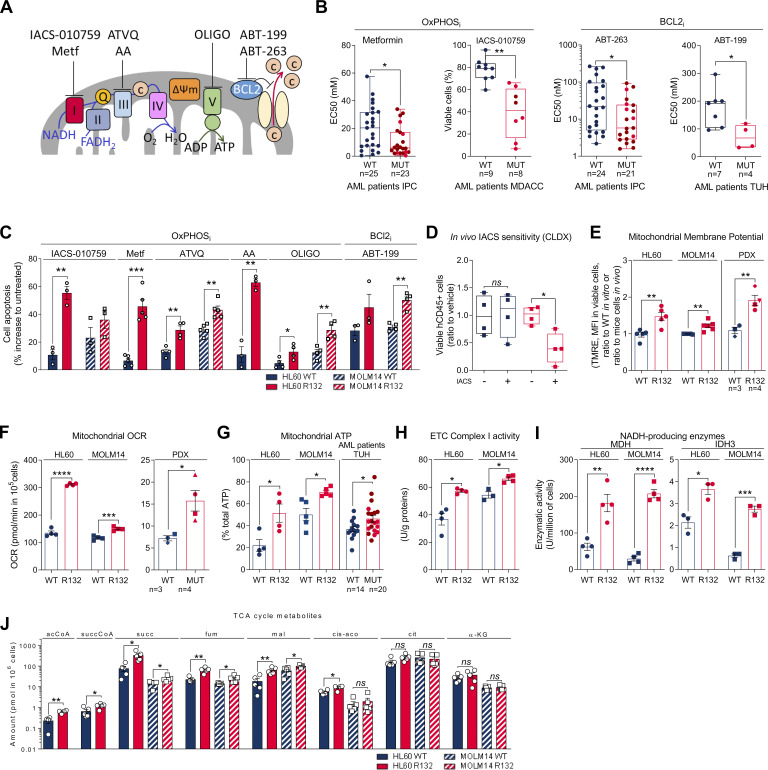
Figure 1.
IDH1m cells exhibit a higher sensitivity to OxPHOSi and BCL2i due to their enhanced mitochondrial capabilities and OxPHOS activity in AML. (A) Schematic representation of the ETC and BCL2 with OXPHOSi and BCL2i used in this study. Metf, metformin. (B) Plots of effective half-maximal concentration (EC50) values from ATP viability assays of metformin and ABT-263 after 48 h, from Annexin V–positive cell assays of ABT-199 after 24 h and percentage of viable cells after 72 h of IACS-010759 in primary samples with WT or mutant (MUT) IDH1 (red circles) or IDH2 (burgundy circles). See also Table S1 for patient information. (C) Apoptosis induction following IACS-010759 (100 nM during 48 h for HL60 and during 6 d for MOLM14; n = 3), 48 h metformin (10 mM; n = 5), AA (10 µM; n = 3), ATVQ (20 µM for HL60; n = 4 and 40 µM for MOLM14; n = 5), oligomycin (OLIGO; 2 µM; n = 4), and ABT-199 (200 nM; n = 3 for HL60 and n = 4 for MOLM14) in HL60 and MOLM14 IDH1 WT or R132H. (D) Total number of human viable AML cells expressing CD45 in vehicle compared with IACS-treated MOLM14 IDH1 WT and R132 mice in bone marrow and spleen (n = 5/group). (E) Assessment of MMP using TMRE assay in HL60 and MOLM14 IDH1 WT or R132H measured in vitro (n = 5, independent experiments) and in vivo in PDXs (three patients IDH1 WT and four patients IDH1 MUT). See also Table S1 for patient information. (F) Mitochondrial OCR of HL60 and MOLM14 IDH1 WT or R132H measured in vitro (n = 4, independent experiments) and ex vivo in PDXs after cell sorting (three patients IDH1 WT and four patients IDH1 MUT). See also Table S1 for patient information. Each point is the mean of three technical replicates. (G) Mitochondrial ATP in HL60 (n = 4) and MOLM14 (n = 5) IDH1 WT and R132H and in patients with IDH WT (n = 14) or MUT IDH1 (red circles) or IDH2 (burgundy circles; n = 21). See also Table S1 for patient information. Each point is the mean of three technical replicates. (H) Mitochondrial ETC complex I activity in HL60 and MOLM14 IDH1 WT and R132H (n ≥ 4). (I) NADH-producing enzyme activities of MDH (n = 4) and IDH3 (n = 3) in HL60 and MOLM14 IDH1 WT and R132H. (J) Acetyl-CoA (acCoA), succinyl-CoA (succCoA), succinate (succ), fumarate (fum), malate (mal), cis-aconitate (cis-aco), citrate (cit), and α-KG amounts measured over 24-h culture in HL60 and MOLM14 IDH1 WT and R132H (n ≥ 4). Each point is the mean of two technical replicates. For each panel, HL60 IDH1 WT is represented in blue by circles (clone 4), whereas R132H is represented in red by circles (clone 11). Results with other clones are described in Fig. S1. MOLM14 is represented by squares, blue for IDH1 WT and red for IDH1 R132H (both induced by doxycycline). Error bars indicate mean ± SEM of at least three independent experiments. Groups were compared with unpaired two-tailed t test with Welch’s correction. *, P < 0.05; **, P < 0.01; ***, P < 0.001; ****, P < 0.0001.

