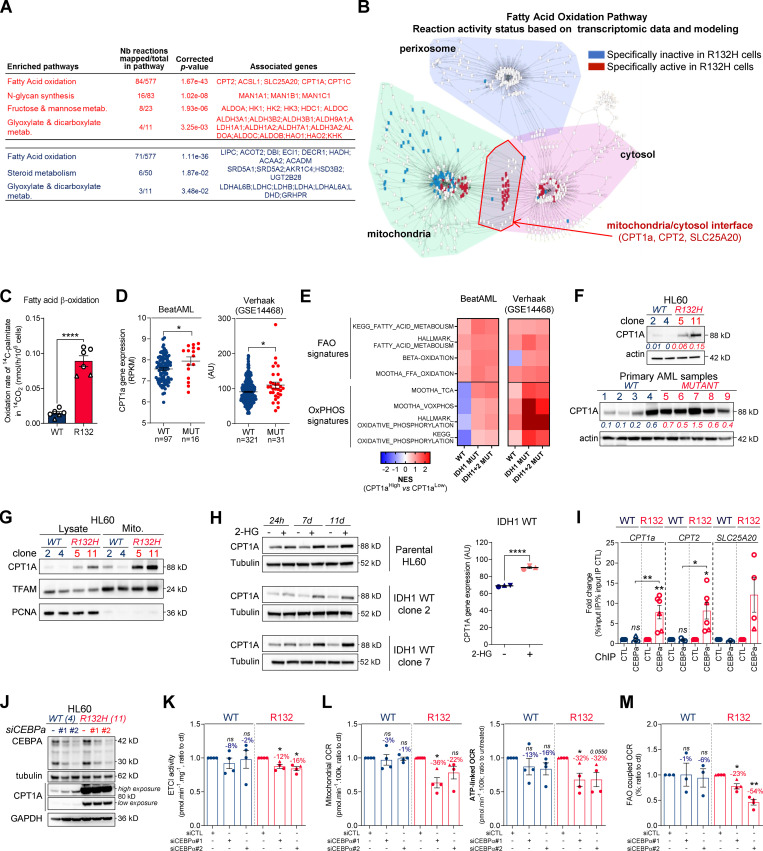
Figure 2.
Methylation- and CEBPα-dependent mitochondrial FAO is increased in IDH1m cells. (A) Comparison of the predicted activity of reactions in the metabolic network of HL60 IDH1 WT versus R132H cells. Predictions of reaction activity or inactivity were made using the Recon2 metabolic network reconstruction and transcriptomic data from HL60 IDH1 WT and R132H. Pathway enrichment was performed on the set of reactions identified as specifically active (red) or specifically inactive (blue) in R132H cells. Corrected P values were obtained by performing a hypergeometric test followed by a Bonferroni correction. (B) Visualization of modulated reactions within the FAO pathway of the Recon2 metabolic network. Reactions predicted to be specifically active (red) or inactive (blue) in R132H using the computational modeling approach were mapped using the MetExplore web server (Chazalviel et al., 2018). (C) 14C palmitate oxidation by HL60 IDH1 WT clone 4 (circle; n = 4) and 2 (triangle; n = 2) and R132H clone 11 (circle; n = 4) and 5 (triangle; n = 2) to assessFAO rate. Each point is the mean of two technical replicates. (D) CPT1a gene expression across AML patient samples from BeatAML (Tyner et al., 2018) and GSE14468 (Verhaak cohort) datasets in function of their IDH1 status. Groups were compared using unpaired nonparametric Mann-Whitney test (*, P < 0.05). (E) Normalized ESs following GSEA analysis of patients with high or low expression of CPT1a (median as the reference) in IDH WT, IDH1m, or IDH1+2 mutant across AML transcriptomes from two independent cohorts, BeatAML and Verhaak (GSE14468). (F) Total lysates of HL60 IDH1 WT and R132H (representative of three independent experiments) and total lysates of primary samples IDH1 WT or MUT were immunoblotted with the indicated antibodies. See also Table S1 for patient information. (G) Total lysates (Lysate) and lysates of purified mitochondria (Mito.) of HL60 IDH1 WT and R132H were immunoblotted with the indicated antibodies (representative of two independent experiments). (H) Total lysates of parental HL60 and HL60 IDH1 WT clones 2 and 7 treated with exogenous 2-HG (100 µM) during 24 h, 7 d, and 11 d were immunoblotted with the indicated antibodies (left panel; representative of two independent experiments). CPT1a gene expression in HL60 IDH1 WT clones 2, 4, and 7 treated with exogenous 2-HG (100 µM) during 2 d (Boutzen et al., 2016). (I) qChIP experiments showing the relative recruitment of CEBPα on CPT1a, CPT2, and SLC25A20 locus in mutant IDH1 R132H versus IDH1 WT HL60, as indicated. Results are represented as the relative ratio between the mean value of IP chromatin (calculated as a percentage of the input) with the indicated antibodies and the one obtained with a control irrelevant antibody. HL60 IDH1 WT is represented in blue by circles (clone 4; n = 4) and triangles (clone 2; n = 2), whereas R132H is represented in red by circles (clone 11; n = 4) and triangles (clone 5; n = 2). (J) Total lysates of HL60 IDH1 WT and R132H transfected with siRNA control or targeting CEBPα were immunoblotted to confirm the knockdown and to measure CPT1a protein expression. This confirmation was performed for each siRNA experiment (n = 4). (K) Mitochondrial ETC complex I activity in HL60 IDH1 WT and R132H transfected with siRNA control or targeting CEBPα (n = 4, independent experiments). (L) Mitochondrial OCR and ATP-linked OCR of HL60 IDH1 WT or R132H transfected with siRNA control or targeting CEBPα (n = 4, independent experiments). Each point is the mean of three technical replicates. (M) FAO-coupled OCR of HL60 IDH1 WT or R132H transfected with siRNA control or targeting CEBPα (n ≥ 3, independent experiments). Each point is the mean of three technical replicates. For each panel except D as indicated, groups were compared with unpaired two-tailed t test with Welch’s correction. *, P < 0.05; **, P < 0.01; ****, P < 0.0001. Error bars indicate mean ± SEM. AU, arbitrary units; NES, normalized ES.

