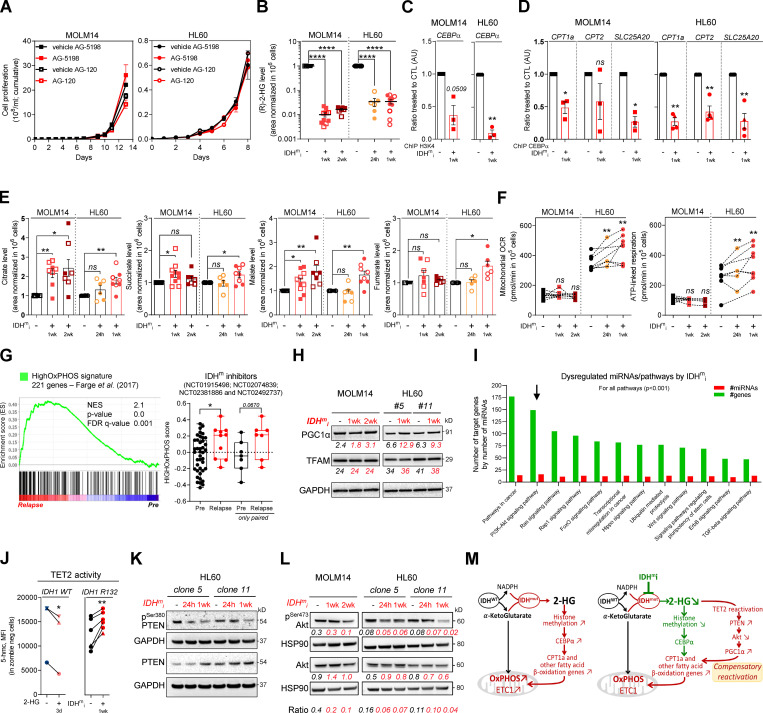
Figure 3.
IDHmi reverse 2-HG production but do not necessarily decrease high OxPHOS phenotype and mitochondrial metabolism. (A) Cumulative cell proliferation through time in MOLM14 and HL60 IDH1 R132H treated with vehicle (DMF) or AG-5198 (2 µM) and vehicle (DMSO) or AG-120 (2 µM; n = 4, independent experiments). (B) 2-HG levels normalized to IS measured over 24-h culture in MOLM14 and HL60 IDH1 R132H following 24-h, 1-wk, or 2-wk treatment with AG-5198 (2 µM, plain symbols) or AG-120 (2 µM, empty symbols; n ≥ 3, independent experiments). (C) qChIP experiments showing the relative recruitment of histone H3 trimethylation at lysine 4 (H3K4me3) on CEBPα promoter in MOLM14 and HL60 IDH1 R132H following 1-wk treatment with AG-5198 (2 µM). Results are represented as the relative ratio between the mean value of IP chromatin (calculated as a percentage of the input) with CEBPα antibody and the one obtained with a control irrelevant antibody, normalized to the untreated condition (n = 3, independent experiments). (D) qChIP experiments showing the relative recruitment of CEBPα on CPT1a, CPT2, and SLC25A20 locus in MOLM14 and HL60 IDH1 R132H following 1-wk treatment with AG-5198 (2 µM). Results are represented as the relative ratio between the mean value of IP chromatin (calculated as a percentage of the input) with the indicated antibodies and the one obtained with a control irrelevant antibody, normalized to the untreated condition. HL60 IDH1 R132H is represented by circles (clone 11; n = 3) and triangles (clone 5; n = 1). (E) Citrate, succinate, malate, and fumarate levels normalized to IS measured over 24-h culture in MOLM14 and HL60 IDH1 R132H following 24-h, 1-wk, or 2-wk treatment with AG-5198 (2 µM, plain symbols) or AG-120 (2 µM, empty symbols; n ≥ 3, independent experiments). (F) Mitochondrial OCR and ATP-linked OCR of MOLM14 and HL60 IDH1 R132H in vehicle (DMF) and after 24-h, 1-wk, or 2-wk treatment with AG-5198 (2 µM; n ≥ 3, independent experiments). (G) GSEA of HighOxPHOS signature (identified by Farge et al., 2017) performed using transcriptomes of patients harboring an IDH mutation included in clinical trials for IDHmi and published (GSE153348) with associated score. (H) Total lysates of MOLM14 and HL60 IDH1 R132H following 1-wk or 2-wk treatment with AG-5198 (2 µM) were immunoblotted with the indicated antibodies relative to mitochondrial regulation. Immunoblot representative of three independent experiments. (I) Bioinformatics analysis of differentially expressed miRNAs following AG-5198 (2 µM) treatment of HL60 and MOLM14 IDH1m cells for 1 wk. The graph is showing the top KEGG pathways of biological function of the targets of all differentially expressed miRNAs between untreated and treated cells. This enrichment pathways analysis utilizes the union of targeted genes by the selected miRNAs before the statistical calculation. For all these analyses, a P value threshold <0.001 was used. The arrow highlights the pathway of interest in this study (PI3K/Akt). (J) Intensities of 5-OH-methylcytosine staining (median) in HL60 IDH1 WT (circle for clone 4, n = 1; up triangle for clone 2, n = 1; and down triangle for clone 7, n = 1) treated with exogenous 2-HG (100 µM) during 3 d and in HL60 IDH1 R132H (circle for clone 11, n = 5; and triangle for clone 5, n = 1) treated 1 wk with AG-120 (2 µM). (K) Total lysates of HL60 IDH1 R132H following 24-h or 1-wk treatment with AG-120 (2 µM) were immunoblotted with the indicated antibodies. (L) Total lysates of MOLM14 and HL60 IDH1 R132H following 24-h, 1-wk, or 2-wk treatment with AG-5198 (2 µM) were immunoblotted with the indicated antibodies relative to signaling proteins and were quantified. Ratio of phosphorylated to total form of Akt was measured to assess the activation of the pathway. (M) Schematic diagram of metabolic reprogramming induced by IDH1 mutation in AML cells and its impact on OxPHOS status through FAO regulation at the steady state and upon treatment with IDHmi. For each panel, groups were compared with unpaired two-tailed t test with Welch’s correction. *, P < 0.05; **, P < 0.01; ***, P < 0.001; ****, P < 0.0001. Error bars indicate mean ± SEM. AU, arbitrary units; CTL, control; FDR, false discovery rate; NES, normalized ES.

