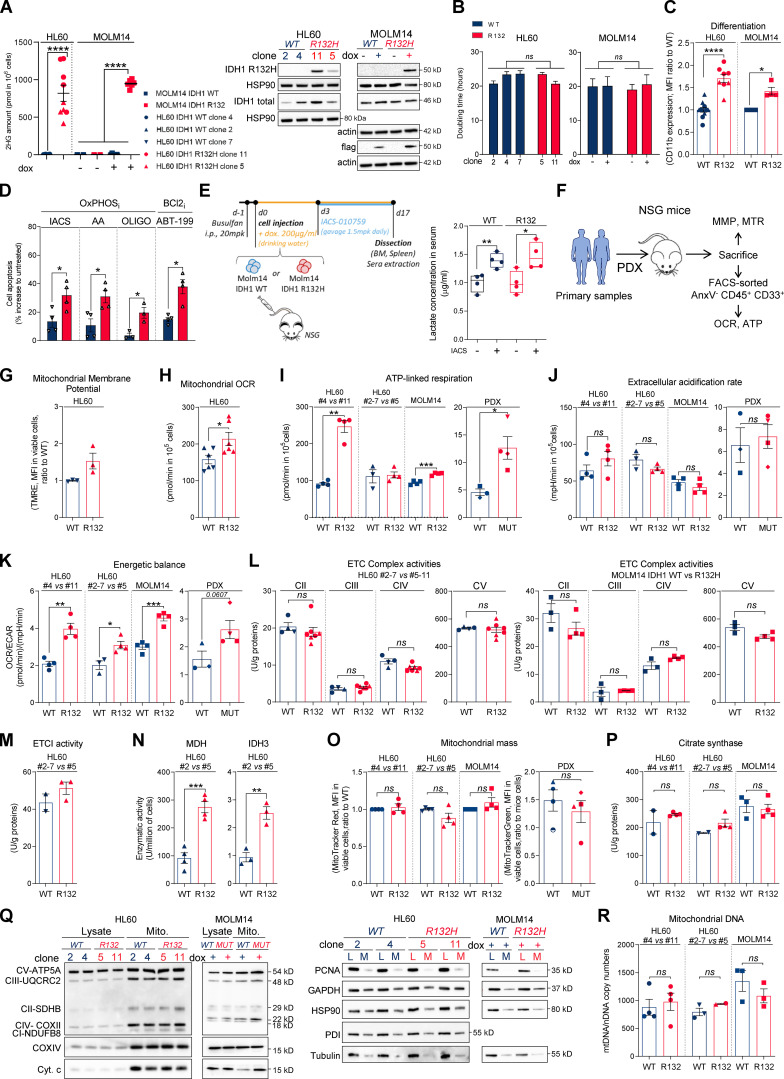
Figure S1.
IDH1m cells exhibit a higher sensitivity to OxPHOSi and BCL2i due to their enhanced mitochondrial capabilities and OxPHOS activity in AML. (A) 2-HG concentration was determined from fresh HL60 (different clones) and MOLM14 IDH1 WT and R132H cells (left panel). Total lysates of HL60 (different clones) and MOLM14 IDH1 WT and R132H were immunoblotted with the corresponding antibodies (right panel; representative of three independent experiments). Error bars indicate mean ± SEM of at least five independent experiments. Each point is the mean of three technical replicates. (B) Doubling time of HL60 (different clones) and MOLM14 IDH1 WT and R132H treated or not with doxycycline (dox). Error bars indicate mean ± SEM of at least three independent experiments. (C) Intensity of CD11b staining (median) HL60 (different clones) and MOLM14 IDH1 WT and R132H treated with doxycycline. Error bars indicate mean ± SEM of at least three independent experiments. (D) Apoptosis induction following 48 h IACS-010759 (100 nM), 48 h metformin (10 mM), AA (10 µM), ATVQ (20 µM), oligomycin (OLIGO; 2 µM), and ABT-199 (200 nM) in other clones of HL60 IDH1 WT (clone 2) or R132H (clone 5). Error bars indicate mean ± SEM of at least three independent experiments. (E) Experimental scheme detailing administration time of IACS-010759 by gavage in MOLM14 CLDX. In this model, IDH1 R132 mutation or IDH1 WT overexpression is induced by doxycycline (left panel). Lactate concentration in the serum of mice engrafted with MOLM14 IDH1 WT and R132H AML cells and treated or not with IACS corresponding to Fig. 1D (right panel). (F) Schematic diagram of the in vivo strategy applied for the experiments described in Fig. 1, Fig. S1, Fig. 4, and Fig. S4. (G) TMRE assay in other clones of HL60 IDH1 WT (clones 2 and 7) or R132H (clone 5) to estimate MMP. Error bars indicate mean ± SEM (n = 3 independent experiments). (H) Mitochondrial OCR in other clones of HL60 IDH1 WT (clones 2 and 7) or R132H (clone 5). Error bars indicate mean ± SEM of at least three independent experiments. Each point is the mean of three technical replicates. (I) ATP-linked respiration of different clones of HL60 and MOLM14 IDH1 WT or R132H measured in vitro (n ≥ 3, independent experiments) and ex vivo in PDXs after cell sorting (three patients IDH1 WT and four patients IDH1 MUT). See also Table S1 for patient information. Error bars indicate mean ± SEM. Each point is the mean of three technical replicates. (J) ECAR of different clones of HL60 and MOLM14 IDH1 WT or R132H measured in vitro (n ≥ 3, independent experiments) and ex vivo in PDXs (three patients IDH1 WT and four patients IDH1 MUT; see also Table S1). Error bars indicate mean ± SEM. Each point is the mean of three technical replicates. (K) Energetic balance corresponding to the ratio between OCR and ECAR of different clones of HL60 and MOLM14 IDH1 WT or R132H measured in vitro (n ≥ 3, independent experiments) and ex vivo in PDXs (three patients IDH1 WT and four patients IDH1 MUT; see also Table S1). Error bars indicate mean ± SEM. Each point is the mean of three technical replicates. (L) Mitochondrial ETC complex II to ETC complex V complex activities in different clones of HL60 (left panel) and MOLM14 (right panel) IDH1 WT and R132H. Error bars indicate mean ± SEM of at least three independent experiments. (M) Mitochondrial ETC complex I activity in other clones of HL60 IDH1 WT (clones 2 and 7) or R132H (clone 5). Error bars indicate mean ± SEM of at least two independent experiments. (N) NADH-producing enzyme activities of MDH and IDH3 in other clones of HL60 IDH1 WT (clone 2) and R132H (clone 5). Error bars indicate mean ± SEM of at least three independent experiments. (O) Mitochondrial mass assay (MTR in cell lines or MTG in PDXs) in different clones of HL60 and MOLM14 IDH1 WT or R132H measured in vitro (n ≥ 4) and ex vivo from PDXs (four patients IDH1 WT and four patients IDH1 MUT). Error bars indicate mean ± SEM. (P) Citrate synthase enzymatic activities measured after 24 h in different clones of HL60 and MOLM14 IDH1 WT or R132H. Error bars indicate mean ± SEM of at least two independent experiments. (Q) Total lysates and lysates of purified mitochondria of different clones of HL60 and MOLM14 IDH1 WT or R132H were immunoblotted with the indicated antibodies related to OxPHOS (left panel) and to assess quality of the mitochondrial (Mito.) extraction (right panel). (R) mtDNA copy numbers in different clones of HL60 and MOLM14 IDH1 WT or R132H. nDNA, nuclear DNA. Error bars indicate mean ± SEM of at least two independent experiments. For each panel, groups were compared with unpaired two-tailed t test with Welch’s correction. *, P < 0.05; **, P < 0.01; ***, P < 0.001; ****, P < 0.0001. BM, bone marrow.

