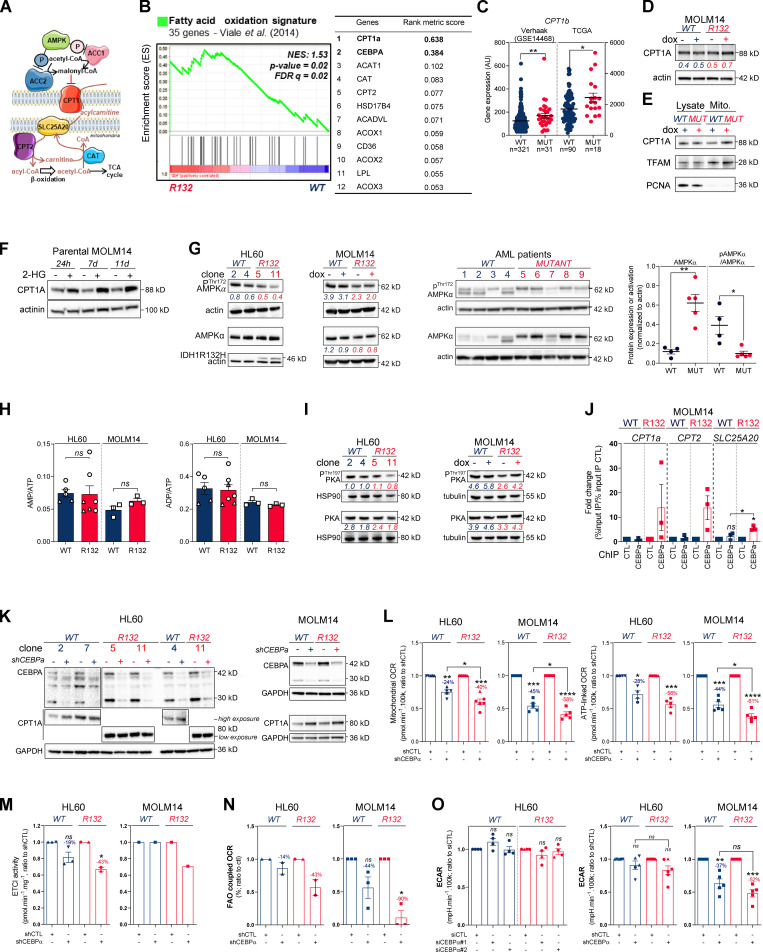
Figure S2.
Methylation- and CEBPα-dependent mitochondrial FAO is increased in IDH1m cells. (A) Schematic representation of FAO and its regulation. (B) GSEA of FAO signature identified by Viale et al. (2014) performed using transcriptomes of HL60 IDH1 R132H clones compared with WT already published (Boutzen et al., 2016) and associated genes with top rank metric scores. (C) CPT1b gene expression across AML patient samples from GSE14468 (Verhaak cohort) and TCGA datasets in function of their IDH1 status. Groups were compared using unpaired nonparametric Mann-Whitney test. (D) Total lysates of MOLM14 IDH1 WT and R132H were immunoblotted with the indicated antibodies (representative of two independent experiments). (E) Total lysates (lysate) and lysates of purified mitochondria (Mito.) of MOLM14 IDH1 WT and R132H were immunoblotted with the indicated antibodies (representative of two independent experiments). (F) Total lysates of parental MOLM14 treated with exogenous 2-HG (50 µM) during 24 h, 7 d, and 11 d were immunoblotted with the indicated antibodies (representative of two independent experiments). (G) Lysates of different clones of HL60 and MOLM14 (left panel) and of AML primary samples (right panel) IDH1 WT or mutant (MUT) were immunoblotted with the indicated antibodies and quantified. (H) AMP/ATP (left panel) and ADP/ATP (right panel) ratios determined by metabolomics in HL60 IDH1 WT (clones 4 and 2) and R132H (clones 11 and 5) and in MOLM14 IDH1 WT and R132H cells. Error bars indicate mean ± SEM of at least three independent experiments. (I) Lysates of different clones of HL60 and MOLM14 IDH1 WT or R132H were immunoblotted with the indicated antibodies and quantified. (J) qChIP experiments showing the relative recruitment of CEBPα on CPT1a, CPT2, and SLC25A20 locus in mutant IDH1 R132H versus IDH1 WT MOLM14, as indicated. Results were represented as the relative ratio between the mean value of IP chromatin (calculated as a percentage of the input) with the indicated antibodies and the one obtained with a control irrelevant antibody. Error bars indicate mean ± SEM of at least three independent experiments. (K) Total lysates of HL60 and MOLM14 IDH1 WT and R132H transfected with shRNA control or targeting CEBPα were immunoblotted to confirm the knockdown and measure CPT1a protein expression. This confirmation was performed for each siRNA experiment (n ≥ 3). (L) Mitochondrial OCR and ATP-linked OCR of HL60 and MOLM14 IDH1 WT or R132H transfected with shRNA control or targeting CEBPα (n ≥ 4, independent experiments). Error bars indicate mean ± SEM. Each point is the mean of three technical replicates. (M) Mitochondrial ETC complex I activity in HL60 and MOLM14 IDH1 WT and R132H transfected with shRNA control or targeting CEBPα. Error bars indicate mean ± SEM of at least two independent experiments for HL60. For MOLM14, only one independent measure was performed. (N) FAO-coupled OCR of HL60 and MOLM14 IDH1 WT or R132H transfected with shRNA control or targeting CEBPα (n ≥ 2, independent experiments). Error bars indicate mean ± SEM. Each point is the mean of three technical replicates. (O) ECAR of HL60 and MOLM14 IDH1 WT or R132H transfected with siRNA or shRNA control or targeting CEBPα (n ≥ 4, independent experiments). For each panel, HL60 IDH1 WT is represented in blue by circles (clone 4), up triangles (clone 2), and down triangles (clone 7), whereas R132H is represented in red by circles (clone 11) or up triangles (clone 5). MOLM14 is represented by squares, blue for IDH1 WT and red for IDH1 R132H (both induced by doxycycline). Error bars indicate mean ± SEM. Each point is the mean of three technical replicates. For all panels except C as indicated, groups were compared with unpaired two-tailed t test with Welch’s correction. *, P < 0.05; **, P < 0.01; ***, P < 0.001; ****, P < 0.0001. AU, arbitrary units; CTL, control; dox, doxycycline; FDR, false discovery rate.

