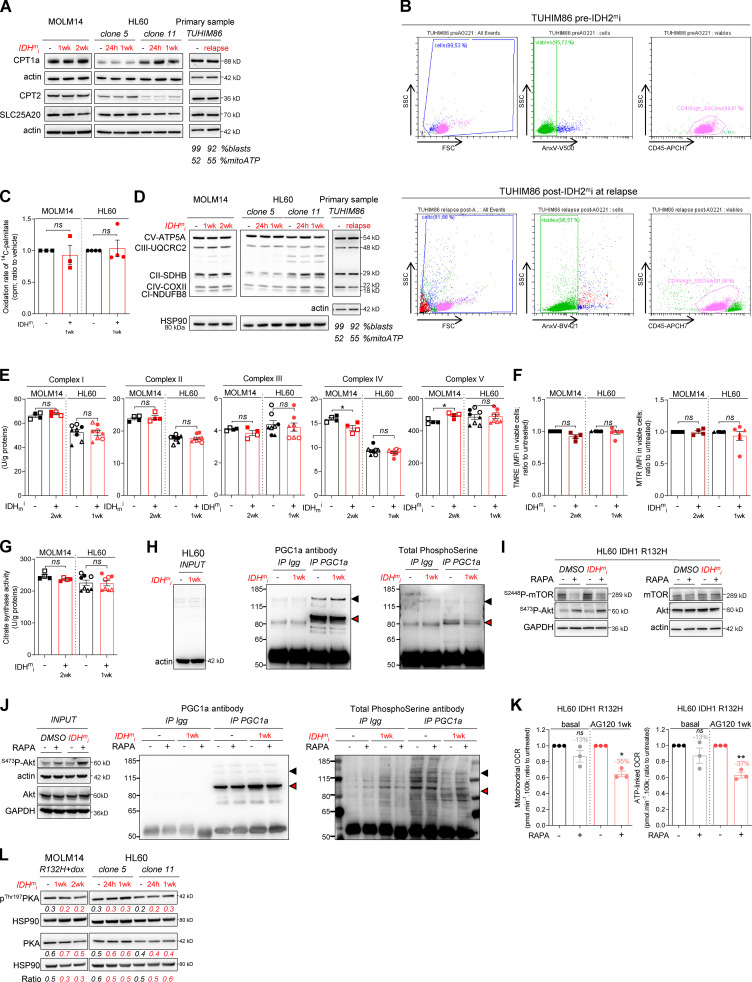
Figure S3.
IDHmi reverse 2-HG production but do not necessarily decrease high OxPHOS phenotype and mitochondrial metabolism. (A) Total lysates of MOLM14 and HL60 IDH1 R132H following 24-h, 1-wk, or 2-wk treatment with AG-5198 (2 µM) were immunoblotted with the indicated antibodies relative to FAO proteins. Total lysates of one primary sample IDH2 MUT before IDH1mi (AG221) and at relapse was immunoblotted with the indicated antibodies. Percentage of blasts determined as CD45dim/SSClow–positive cells and percentage of mitochondrial ATP (mitoATP) are given for both time points. See gating strategy in B and Table S1 for patient information. (B) Gating strategy used to assess the percentage of AML blasts in primary AML specimen TUHIM86 before treatment with IDHmi and at relapse. Human peripheral blood mononuclear cells are gated based on the forward (FSC) and side scatter (SSC). Dead cells are excluded with Annexin V staining. AML blast gate is CD45dim and SSClow. (C) 14C palmitate oxidation by MOLM14 and HL60 IDH1 R132H following 1-wk treatment with AG-5198 (2 µM) to assess FAO rate. Error bars indicate mean ± SEM of three independent experiments. Each point is the mean of three technical replicates. The results are given in mean counts per minute (cpm) and normalized to the untreated condition. (D) Total lysates of MOLM14 and HL60 IDH1 R132H following 24-h, 1-wk, or 2-wk treatment with AG-5198 (2 µM) were immunoblotted with the indicated antibodies relative to ETC proteins (representative of at least three independent experiments). Total lysates of one primary sample IDH2 MUT before IDH1mi (AG221) and at relapse were immunoblotted with the indicated antibodies. (E) Mitochondrial ETC complex activities in different clones of HL60 and MOLM14 IDH1 R132H following 1- or 2-wk treatment with AG-5198 (2 µM, plain circles) or AG-120 (2 µM, empty circles). Error bars indicate mean ± SEM of at least four independent experiments. (F) MMP (TMRE assay) and mitochondrial mass (MTR stain) in viable cells measured in different clones of HL60 and MOLM14 IDH1 R132H following 1 or 2 wk of treatment with AG-5198 (2 µM), respectively. Error bars indicate mean ± SEM of at least three independent experiments. (G) Citrate synthase enzymatic activity measured after 24 h in HL60 and MOLM14 IDH1 R132H following 1- or 2-wk treatment with AG-5198 (2 µM, plain circles) or AG-120 (2 µM, empty circles), respectively. Error bars indicate mean ± SEM of at least four independent experiments. (H) IP of PGC1α was followed by immunoblotting using total phosphoserine antibody (right panel) in HL60 IDH1 R132H following 1-wk treatment with control (DMSO) or AG-120 (2 µM). Immunoblots of the inputs confirmed same amount of proteins loaded in the two conditions (left panel). The arrowheads highlight the bands corresponding to PGC1a. (I) Akt was activated through short mTOR inhibition with rapamycin (4 h, 100 nM) in HL60 IDH1 R132H following 1-wk treatment with AG-120 (2 µM). Corresponding total lysates were immunoblotted with the indicated antibodies. (J) IP of PGC1α was followed by immunoblotting using total phosphoserine antibody (right panel) in HL60 IDH1 R132H following 1-wk treatment with control (DMSO) or AG-120 (2 µM) and treated with rapamycin (4 h, 100 nM). Immunoblots of the inputs confirmed same amount of proteins loaded in the two conditions and activation of Akt with rapamycin (left panel). The arrowheads highlight the bands corresponding to PGC1a. (K) Mitochondrial OCR and ATP-linked OCR of HL60 IDH1 R132H following 1-wk treatment with control (DMSO) or AG-120 (2 µM) and treated with rapamycin (4 h, 100 nM). For each panel, HL60 IDH1 WT is represented in blue by circles (clone 4), up triangles (clone 2), and down triangles (clone 7), whereas R132H is represented in red by circles (clone 11) or up triangle (clone 5). MOLM14 is represented by squares, blue for IDH1 WT and red for IDH1 R132H (both induced by doxycycline). Error bars indicate mean ± SEM of three independent experiments. Each point is the mean of three technical replicates. (L) Total lysates of two different clones of HL60 and MOLM14 IDH1 R132H following 24-h, 1-wk, or 2-wk treatment with AGI-5198 (2 µM) were immunoblotted with the indicated antibodies. For each panel, groups were compared with unpaired two-tailed t test with Welch’s correction. *, P < 0.05; **, P < 0.01. CI, complex I; CII, complex II; CIII, complex III, CIV, complex IV; CV, complex V.

