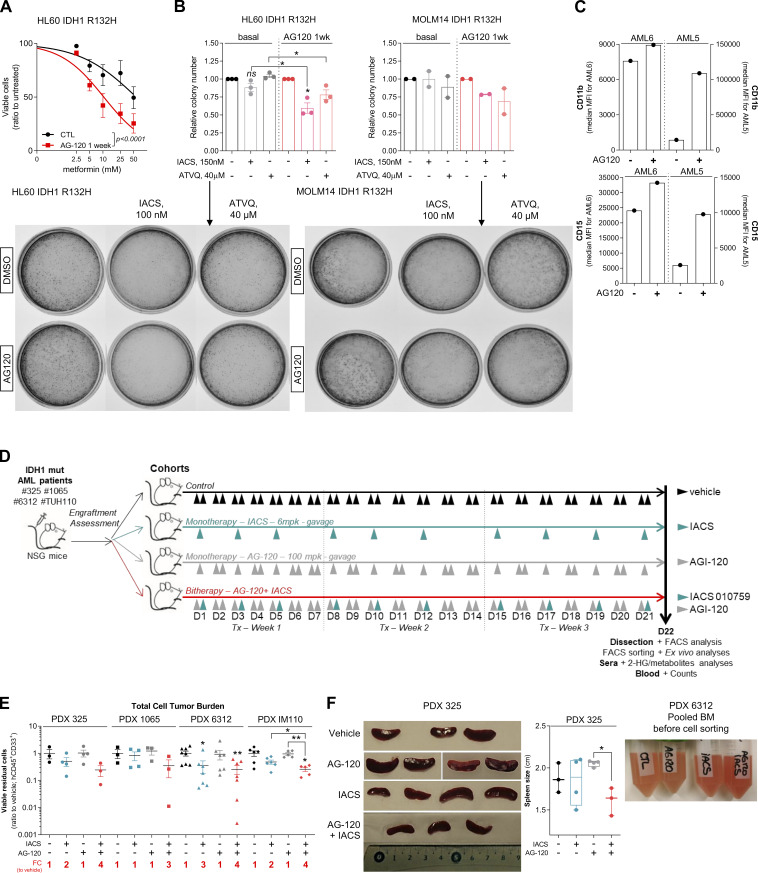
Figure S4.
Treatment with an OxPHOS inhibitor enhances antileukemic effects of IDHmi in IDH1m primary samples ex vivo and in vivo. (A) Percentage of viable cells measured by flow cytometry (% AnxV neg) of HL60 IDH1 R132H following 1-wk pretreatment with control (DMSO) or AG-120 (2 µM) and treated with increasing concentrations of metformin. Error bars indicate mean ± SEM of at least three independent experiments. (B) Relative colony number (ratio to ctl) assessed in methylcellulose assays after a 6-d incubation of HL60 and MOLM14 IDH1 R132H pretreated 1 wk with control (DMSO) or AG-120 (2 µM) and then treated with IACS or ATVQ. Corresponding representative photographs of colony-formation units stained using MTT assay (10 mg/ml; 2 h, 37°C). The pictures of each well were taken at the same time. The numbers of colonies with ≥20 cells were counted manually under the microscope. (C) CD11b and CD15 intensities staining measured by flow cytometry of the two primary samples AML5 and AML6 after a 17-d and a 27-d incubation with AG-120, respectively. (D) Experimental scheme detailing exhaustive administration times of IACS-010759 and AG-120 by gavages in PDX models of AML. (E) Total number of human viable AML cells expressing CD45 and CD33 in mono or duplet therapies compared with vehicle for each IDH1 R132 PDXs 325, 1065, 6312, and TUH110 in bone marrow and spleen. Fold change (FC) between the mean of each group and the mean of vehicle was calculated. (F) Photos and corresponding spleen size from mice of PDX 325. Photos of the different groups were taken separately to allow direct and quick crushing but with the same ruler and dimensions to allow comparison (left panel). Photo of the pooled BM of the mice of each treatment group of PDX 6312 before cell sorting (right panel). For each panel, groups were compared with unpaired two-tailed t test with Welch’s correction. *, P < 0.05; **, P < 0.01. BM, bone marrow; ctl, control; Tx, treatment.

