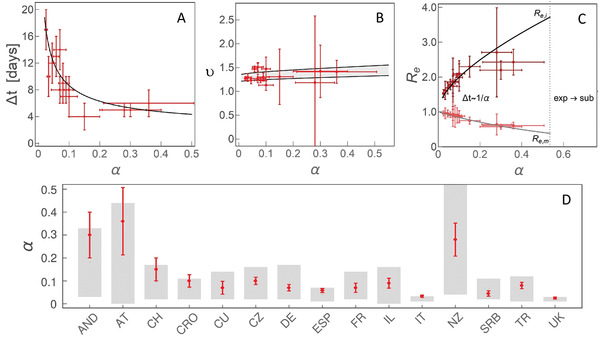
Figure 2.

The dependence on the effective social distancing strength () of A) , the duration of the superlinear regime, B) , the scaling exponent of the superlinear regime, C) , effective reproduction number at the left inflection point () and the maximum () of . indicates that the time, in which the change from to is exhibited, is approximately inversely proportional to . “” indicates the region of where we predict a direct transition from exponential to sublinear growth. D) Comparison of constrained from analytical derivations (the grey bands) and numerical analysis, with countries indicated on the horizontal axis by their abbreviations. Results obtained by independent numerical analysis are presented by red dots with corresponding errorbars.
