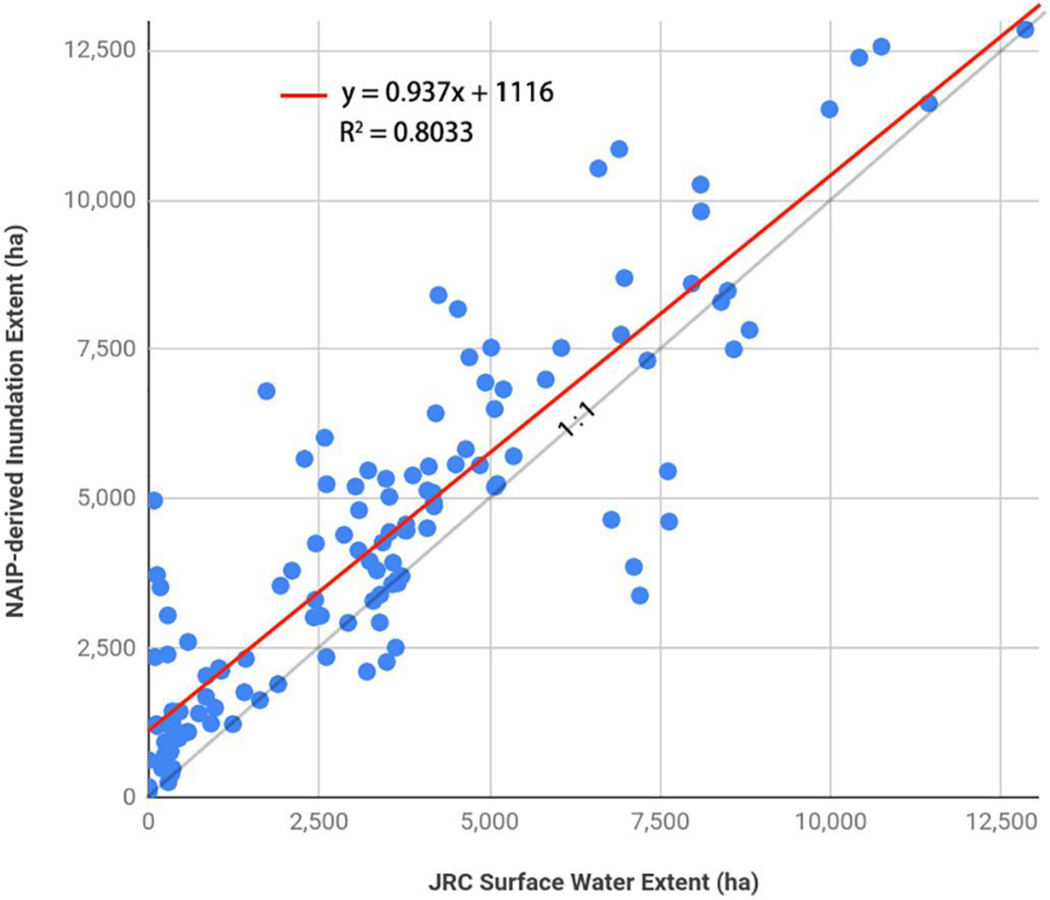
Fig. 9.
Comparison between NAIP-derived and Landsat-derived JRC surface water extent at the HUC-10 watershed scale in the study area. Each point represents the inundation area of an individual watershed derived from one-time NAIP imagery (e.g., September 2015) and coincident JRC Monthly Water History. In the study area, there are five time periods (2009–2015) of NAIP images with coincident JRC Monthly Water History (see Table 1), resulting in a total of 130 points being plotted in this figure.

