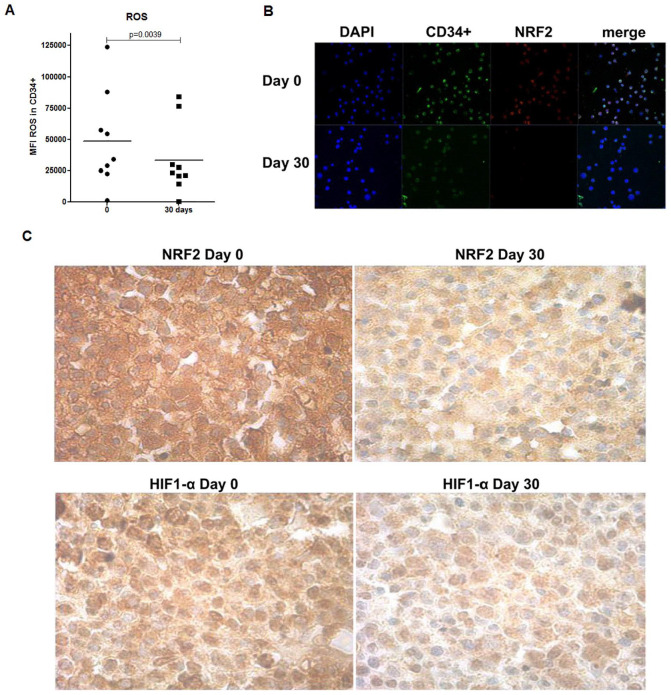
Figure 4.
GT treatment on BM cells and biopsies of elderly AML-MRC patients. (A) ROS levels in BM CD34+ cells expressed as MFI were analyzed by flow cytometry. (B) Representative image of NRF2 expression in BM CD34+ cells analyzed by immunofluorescence microscopy. Images were collected using 63× optical zoom. (C) Representative image of NRF2 and HIF-1α protein expression in BM biopsy specimens analyzed before by immunohistochemistry using a 40× objective. BM samples of 10 AML-MRC patients were analyzed before and after 30 days of treatment.
Abbreviations: AML-MRC, acute myeloid leukemia with myelodysplasia-related changes; BM, bone marrow; GT, green tea; MFI, mean fluorescence intensity; ROS, reactive oxygen species.

