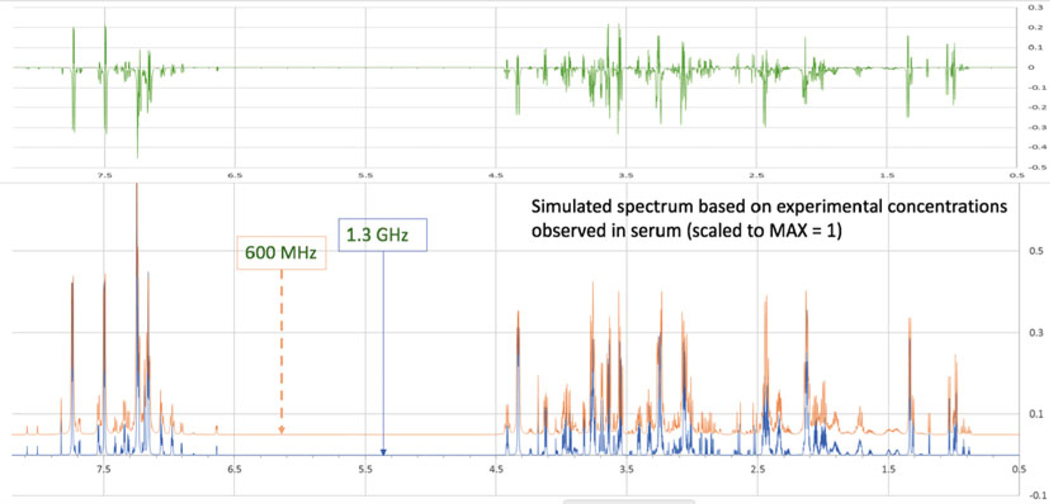
Fig. 3.
Simulated spectrum of a biological mixture created from GISSMO spectral templates. Simulated 1H NMR spectra at 600 MHz (red) and 1.3 GHz (blue) of the 34 most abundant metabolites of blood plasma at their relative concentrations. The difference spectrum (green) shown above documents the additional level of detail available at the higher magnetic field

