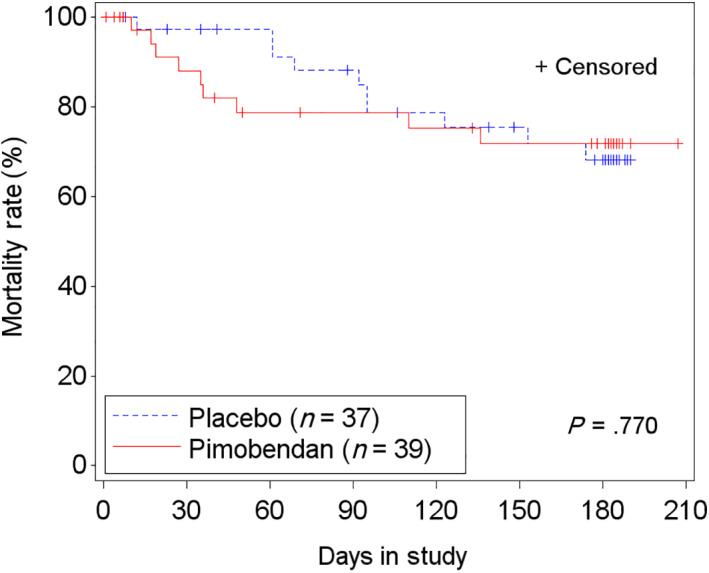
FIGURE 7.

Kaplan‐Meier curves of the time‐to‐event analysis of cardiac morbidity and mortality (cardiac death, cardiac euthanasia, and furosemide dose >10 mg/kg/d) for the full analysis set (FAS) population. 9/39 cats on pimobendan and 10/37 cats on placebo reached the secondary end‐point. +, censored
