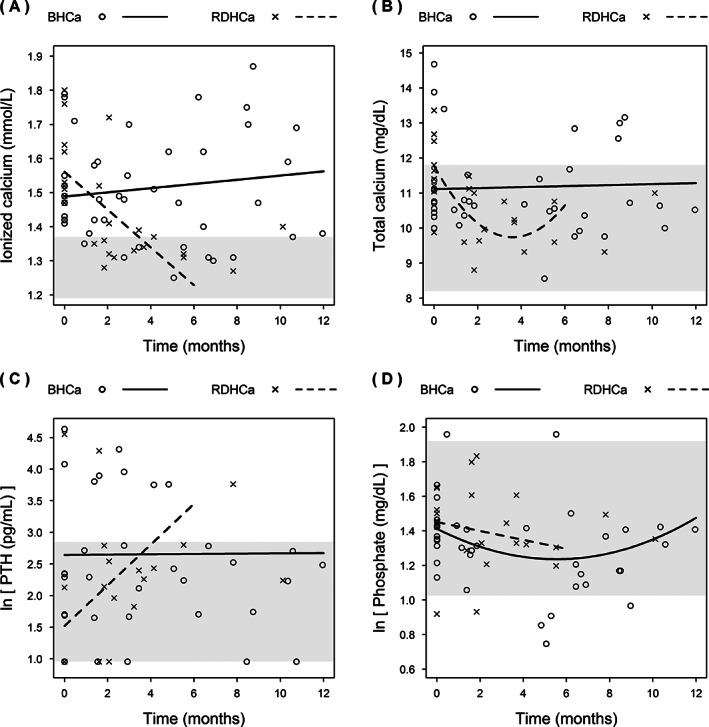
FIGURE 2.

Change in blood ionized calcium concentrations (A), plasma total calcium (B), PTH (C), and phosphate concentrations (D) over time in cats with ionized hypercalcemia at diagnosis of azotemic CKD (BHCa, n = 11) and cats that developed ionized hypercalcemia during the course of CKD (RDHCa, n = 10) that were transferred to a moderately protein and phosphate restricted diet. Reference intervals are shown with a shaded area where applicable. Because of a very small number of data points occurring after the 6 month time point in the RDHCa group, only data up until 6 months were included in the model for this group
