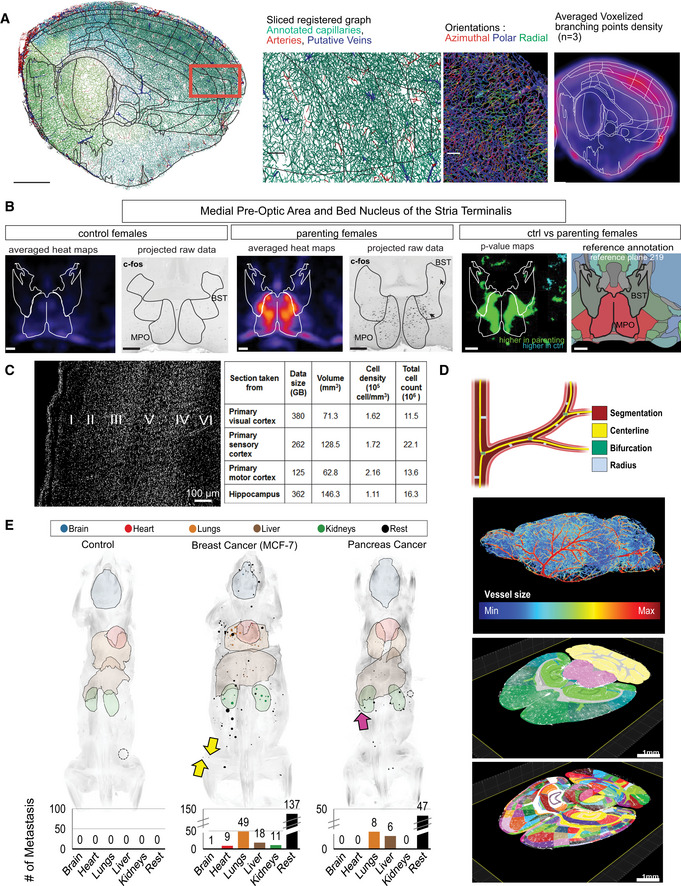
Figure 3. Analysis tools for tissue clearing applications.

-
(A)TubeMap pipeline which demonstrates the fine‐scale organization on the brain vasculature. In this study, Kirst et al (2020) demonstrated how stroke affects the brain, using antibody labeling.
-
(B)The ClearMAP pipeline is used for examining parental behavior through Fos activity in the whole brain followed by a filter‐based analysis.
-
(C)SHANEL pipeline has one of the recent algorithms that include deep learning methods to analyze big tissues to quantify cleared human brain tissues identified in the six layers of primary visual cortex. The summary of the cell properties from different brain regions taken from cortex and hippocampus were analyzed using the authors’ CNN.
-
(D)The VesSAP pipeline, which can extract features and registers the mouse brain vasculature to Allen Brain Atlas. Images represent the steps of feature extraction, radius illustration, and vascular segmentation.
-
(E)The DeepMACT pipeline, which detects metastasis throughout organs in adult mice. Each dot represents a metastasis. Used with permission from (A) Cell (Kirst et al, 2020), (B) Cell (Renier et al, 2016), (C) Cell (Zhao et al, 2020), (D) Nature Methods (Todorov et al, 2020), (E) Cell (Pan et al, 2019).
