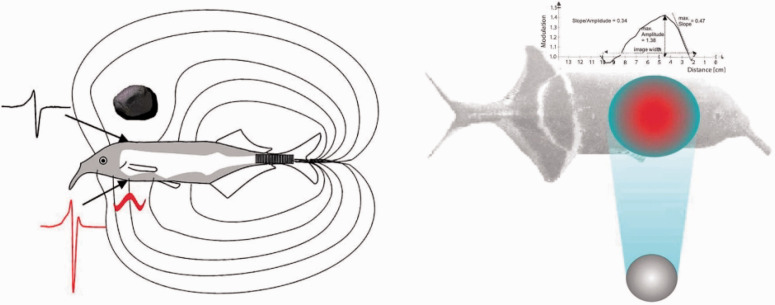
Figure 1.
Sketch of electrolocation in the weakly electric fish, G. petersii. A: Electric field generated by EOD; field lines illustrate current flow. A resistive rock (above) reduces current density and the amplitude of the local EOD waveform (black). A conductive larva (below) increases current density and its capacitance distorts the local waveform (red). B: Electric “shadow” of a metal sphere cast on skin (red indicates increase and blue decrease in relative amplitude). Above, Mexican hat profile of local voltages measured along the body, illustrating the rostral slope/peak amplitude ratio (from von der Emde, 2006, with permission).

