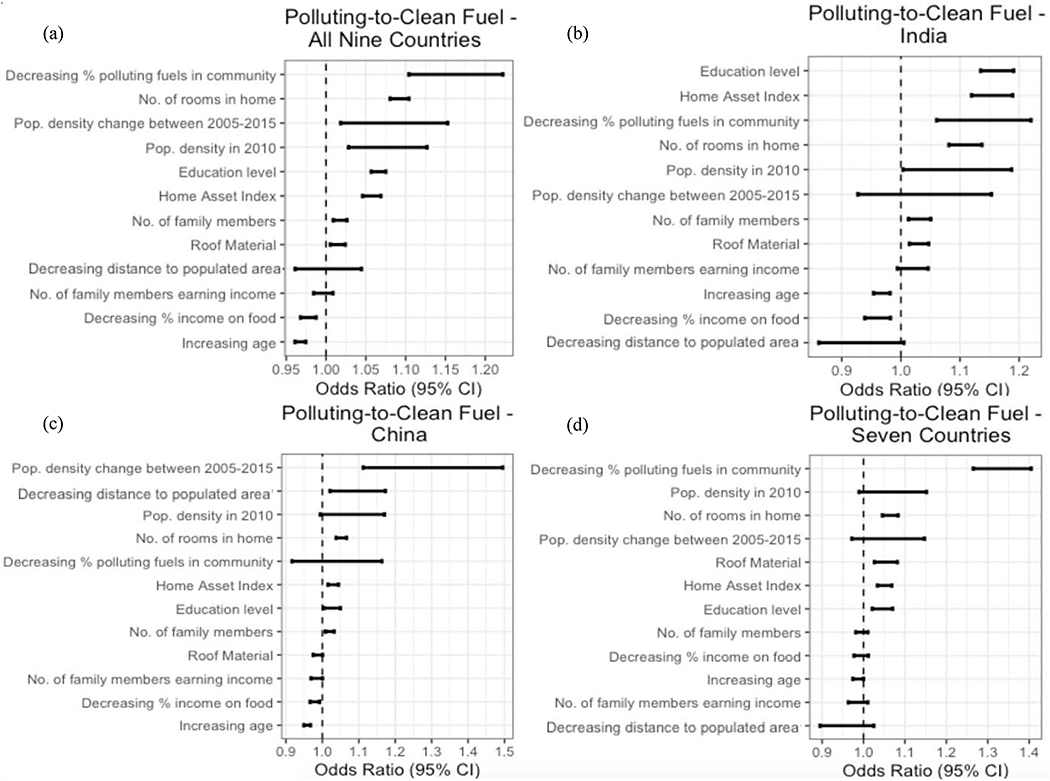
Figure 3.
Odds of switching from polluting to clean fuels in (a) all nine countries (b) India (c) China (d) seven countries excluding China and India, ranked by strength of relationship with household and community level factors. ORs represent odds of primary fuel switching among households in the highest tertile of the variable relative to the lowest tertile (see Table S2 for tertile cutoff points), controlling for study design variables. Notes: All figures are not on the same scale.

