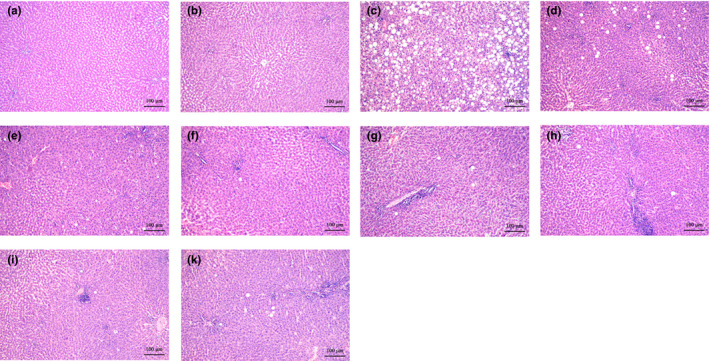
FIGURE 1.

Representative histological images of liver sections from the ASH‐rat study: (a) Control, (b) isocaloric +solvent, (c) EtOH +solvent, (d) I‐ol (0.4 mg/kg b.w.) + EtOH, (e) I‐ol (4 mg/kg b.w.) + EtOH, (f) I‐ol (40 mg/kg b.w.) + EtOH, (g) I‐an (0.4 mg/kg b.w.) + EtOH, (h) I‐an (4 mg/kg b.w.) + EtOH, (i) I‐an (40 mg/kg b.w.) + EtOH, and (k) UDCA (40 mg/kg b.w.) + EtOH. Nine sections of each liver were prepared, with six or eight animals per group. All sections were stained with H. E. (original magnification: 100×; each scale bar indi‐cates 100 μm). EtOH =5% (m/m) ethanol in drinking water. Isocaloric =addition of maltodextrin to compensate for the pure caloric effect of ethanol
