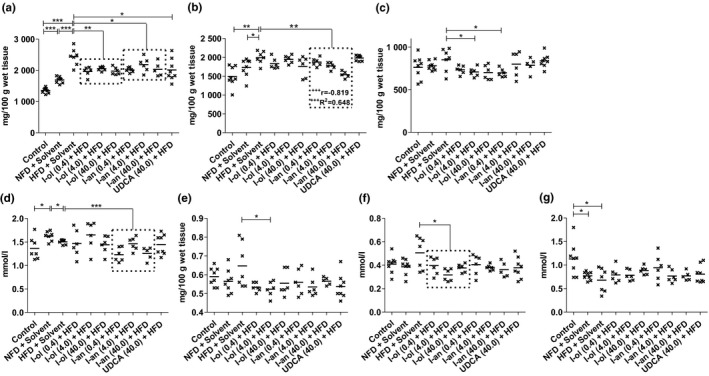
FIGURE 5.

Liver and serum fat content: Rats from the disease group (n = 8) and treatment groups (n = 6 to 8) were offered HFD permanently (ad libitum). (a) Level of hepatic triglycerides (b) Level of hepatic phospholipids (c) Hepatic cholesterol level. (d) Level of serum triglycerides (e) Serum VLDL level. (f) Serum LDL cholesterol level (g) Serum HDL cholesterol level. Bonferroni adjustment for multiple comparisons reduced the significance level to * p < 0.0167, ** p < 0.00333, and *** p < 0.000333. Dose‐dependent effects were specified by Pearson's correlation coefficient ‘r’ and linear regression analysis by the coefficient of determination ‘R2’ with + p < 0.05, ++ p < 0.01, and +++ p < 0.001
