FIGURE 7.

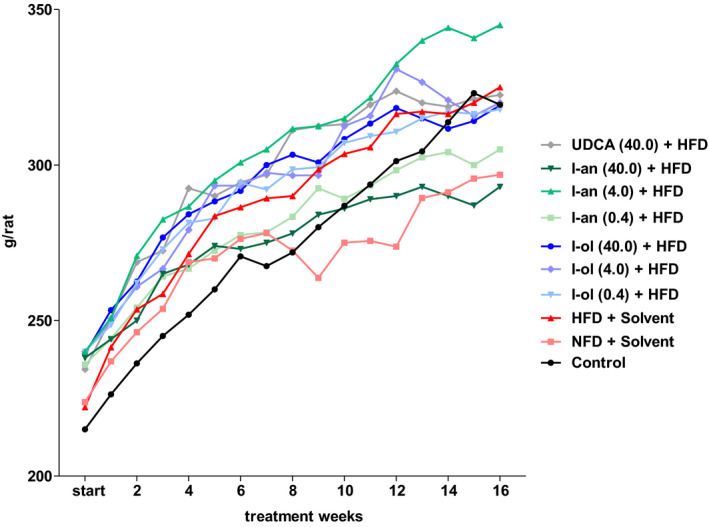
Body weight dynamics: Rats from the disease group (n = 8) and treatment groups (n = 6 to 8) were offered HFD permanently (ad libitum). Each point represents the arithmetic mean value. For a better view, the error bars have been omitted

Body weight dynamics: Rats from the disease group (n = 8) and treatment groups (n = 6 to 8) were offered HFD permanently (ad libitum). Each point represents the arithmetic mean value. For a better view, the error bars have been omitted