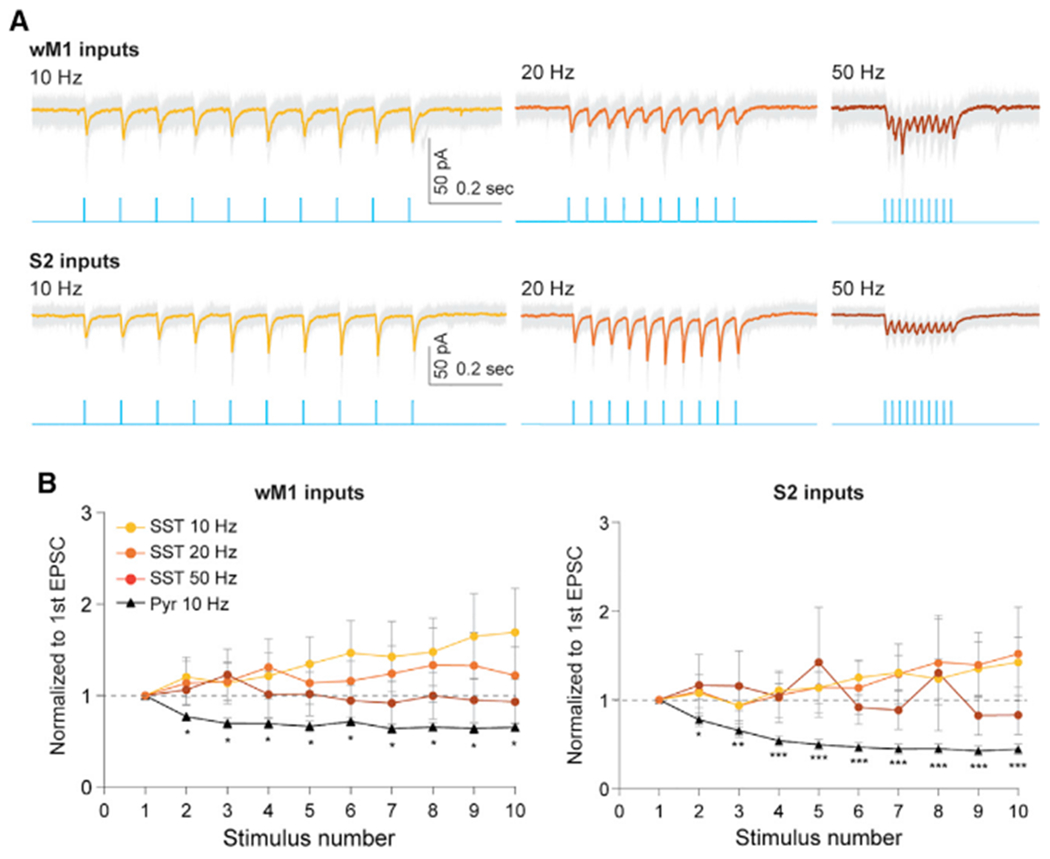
Figure 4. Synaptic dynamics of SST INs to long-range excitatory inputs.

(A) Example traces showing EPSC responses of SST INs to a wide range of photostimulation frequencies of wM1 (top panel) and S2 (bottom panel) inputs. Blue traces indicate train of photostimulation (470 nm, ten pulses, 3 ms duration) delivered at 10, 20, and 50 Hz. Gray traces depict individual sweeps, colored traces indicate the average of these sweeps.
(B) Population data of SST INs (circle) and Pyr neurons (triangle) showing short-term dynamics upon stimulation of wM1 (left) and S2 (right) inputs. Although EPSC amplitudes in Pyr neurons were strongly attenuated, EPSCs recorded from SST INs were stable over a wide range of stimulation frequencies. The peak amplitude of the EPSCs in each cell was normalized to that of the first EPSC. *p < 0.05, **p < 0.05, and ***p < 0.0005 (Wilcoxon signed-rank test).
See also Figure S5.
