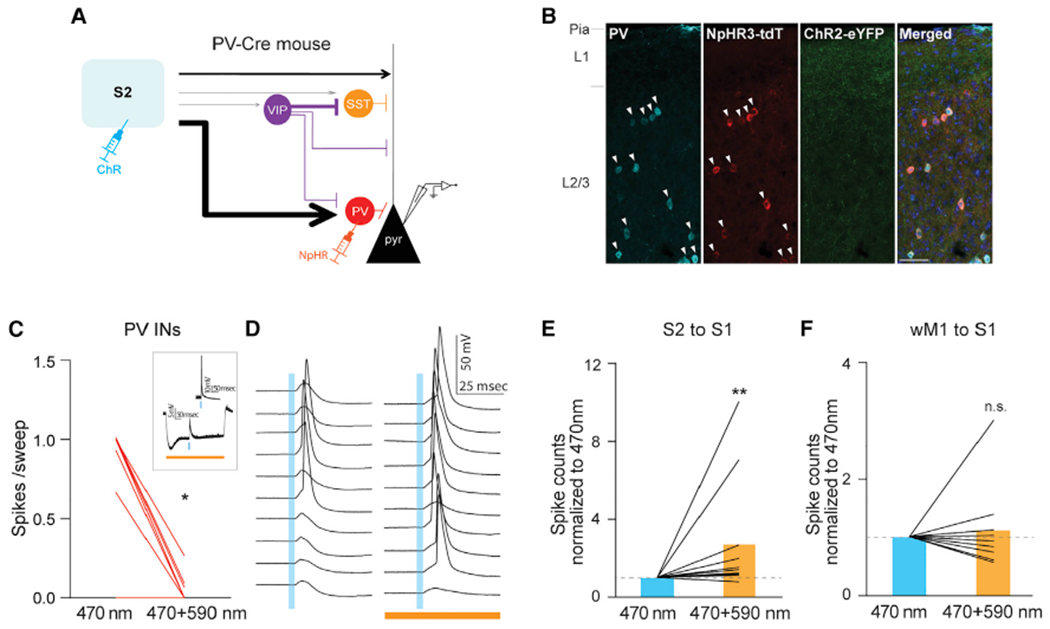
Figure 5. S2 inputs engage PV-IN-mediated feedforward inhibition of local pyramidal neurons in supragranular layers of S1.

(A) Schematic of experimental design.
(B) Expression of eNpHR3.0-tdTomato was restricted to PV INs. All eNpHR3.0-tdTomato expressing neurons were PV positive (arrowhead). Scale bar, 50 μm.
(C) Photostimulation-evoked strong hyperpolarization of PV INs effectively blocked S2-driven spiking activity from PV INs. For each PV cell, averaged spikes evoked by 470 nm only or by 470 + 590 nm photostimulation were plotted (470 nm only versus 470 + 590 nm, 0.50 ± 0.13 versus 0.03 ± 0.02 spikes/sweep, 13 cells, three mice, *p = 0.0156, Wilcoxon signed-rank test). The inset shows an example of a PV cell.
(D) Photo-suppression of PV INs increased spiking probability of a Pyr neuron in response to photo-activation of S2 input. Example traces showing spiking activity of a L2/3 Pyr cell to 470 nm light only (left) and to 470 and 590 nm concurrent light stimulation (right).
(E) Population data of L2/3 Pyr cells upon S2 stimulation.
(F) wM1 inputs did not drive PV-IN-mediated feedforward inhibition of local pyramidal neuronsin supragranular layers of S1. Population data of L2/3 Pyr cells upon wM1 stimulation. Plotting conventions are same as E except photoactivation of wM1 axons instead of S2 activation. Blue bars indicate 470 nm stimulation (3 ms), orange bar indicates 590 nm (500 ms) stimulation. **p = 0.0029 (Wilcoxon signed-rank test).
See also Figure S6.
