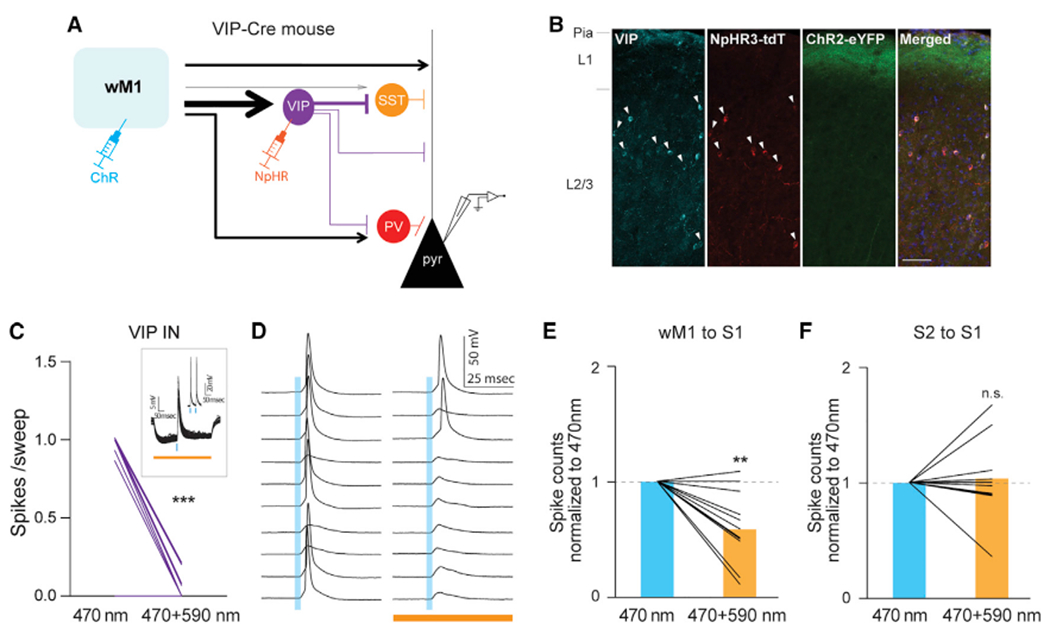
Figure 6. wM1 inputs engage VIP-IN-mediated disinhibition of local pyramidal neurons in supragranular layers of S1.

(A) Schematic of experimental design.
(B) Expression of eNpHR3.0-tdTomato was restricted to VIP INs. All eNpHR3.0-tdTomato expressing neurons were VIP positive (arrowhead). Scale bar, 50 μm.
(C) Photostimulation-evoked strong hyperpolarization of VIP INs effectively block wM1-driven spiking activity from VIP INs. For each VIP cell, averaged spikes evoked by 470 nm only or 470 + 590 nm photostimulation were plotted (470 nm only versus 470 + 590 nm, 0.68 ± 0.11 versus 0.03 ± 0.01 spikes/sweep, 17 cells, four mice, ***p = 0.0005, Wilcoxon signed-rank test). The inset shows an example of a VIP cell.
(D) Photo-suppression of VIP INs increased spiking probability of a Pyr neuron in response to photo-activation of wM1 input. Example traces showing spiking activity of a layer 2/3 Pyr cell to 470 nm only (left) and to 470 and 590 nm concurrent stimulation (right).
(E) Population data of layer 2/3 Pyr cells upon wM1 stimulation.
(F) S2 inputs did not drive VIP-IN-mediated disinhibition of local pyramidal neurons in supragranular layers of S1. Population data of layer 2/3 Pyr cells upon S2 stimulation. Plotting conventions are same as (E) except photoactivation of S2 axons instead of wM1 axons. Blue bars indicate 470 nm stimulation (3 ms), orange bar indicates 590 nm (500 ms) stimulation. **p = 0.0059 (Wilcoxon signed-rank test).
See also Figure S6.
