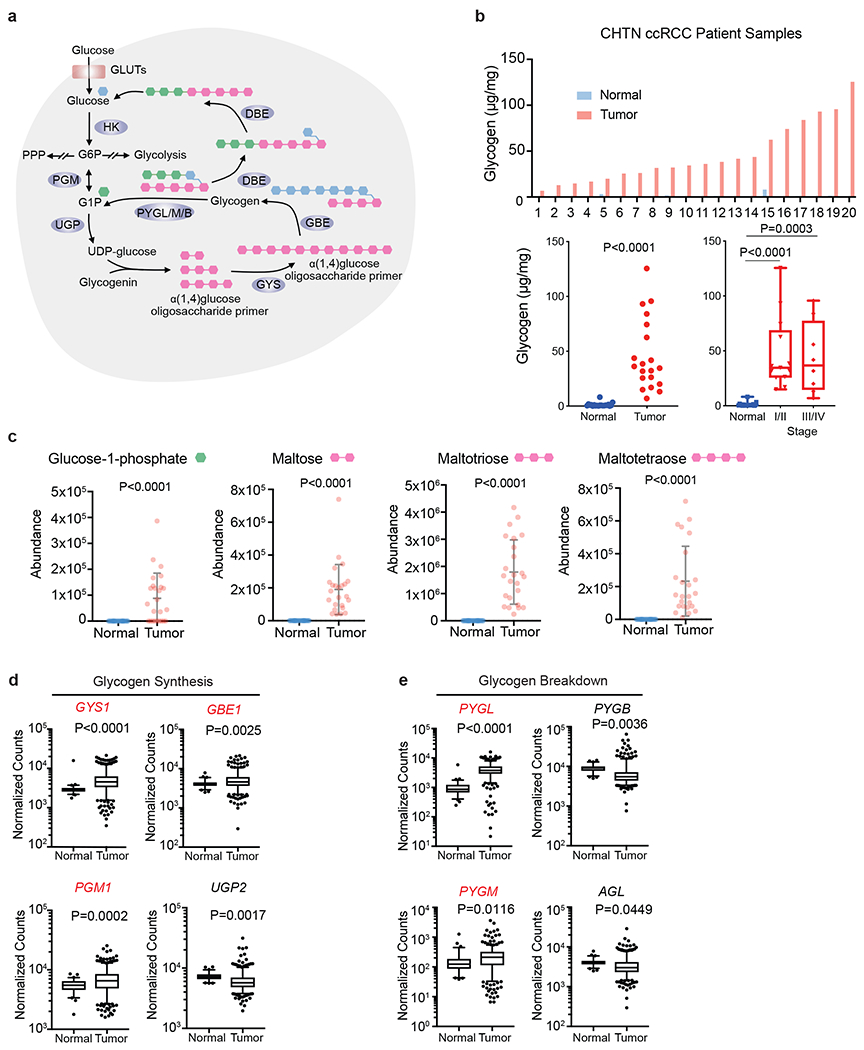
Figure 1. Glycogen synthesis and breakdown are hyperactive in ccRCC tumors.

a. Schematic representation of glycogen synthesis and breakdown pathway in the cytosol. Briefly, glucose conversion into glucose-1-phopshate (G1P) is added or subtracted from oligosaccharide chains scaffolded by the core protein, glycogenin. Green hexagon: singly added glucose-1-phosphate; Pink hexagon: polysaccharide molecules added; Blue hexagon: units added as new branch. b. Upper panel: Glycogen extracted from 20 pairs of fresh frozen ccRCC patient tumors and adjacent normal kidneys and then quantified using glycogen assay kit (see Methods). Lower panels: Summary of tumors analyzed for glycogen levels, and subdivided according to tumor stage; n=20 biologically independent human ccRCC tumor/normal paired samples. Box plots (min. to max. all points): center=median, bounds=25th and 75th percentiles, whiskers=min. and max. values. c. Abundance of glycogen metabolism related metabolites in same human ccRCC tumor/normal paired samples. Data presented as mean +/− SEM. d, e. Normalized RNA-seq reads of glycogen synthesis genes (PGM1, UGP2, GYS1, and GBE1) and glycogen breakdown genes (PYGL, PYGB, PYGM, and AGL) in ccRCC (n=428) and normal kidney (n=66) samples; n denotes biologically independent human tissue samples. RNA-seq data obtained from TCGA. Box plots (min. to max. all points): center=median, bounds=25th and 75th percentiles, whiskers=5th and 95th percentiles. P values determined by two-tailed Student’s t test. GLUT: glucose transporter; HK: hexokinase; PPP: pentose phosphate pathway PGM: phosphoglucomutase; UGP: UDP-glucose pyrophosphatase; UDP-glucose: uridine diphospho-glucose; GYS: glycogen synthase; GBE: glycogen branching enzyme; PYGL/M/B: glycogen phosphorylase, liver/muscle/brain; DBE (encoded by AGL): debranching enzyme. Red denotes gene expression increase.
