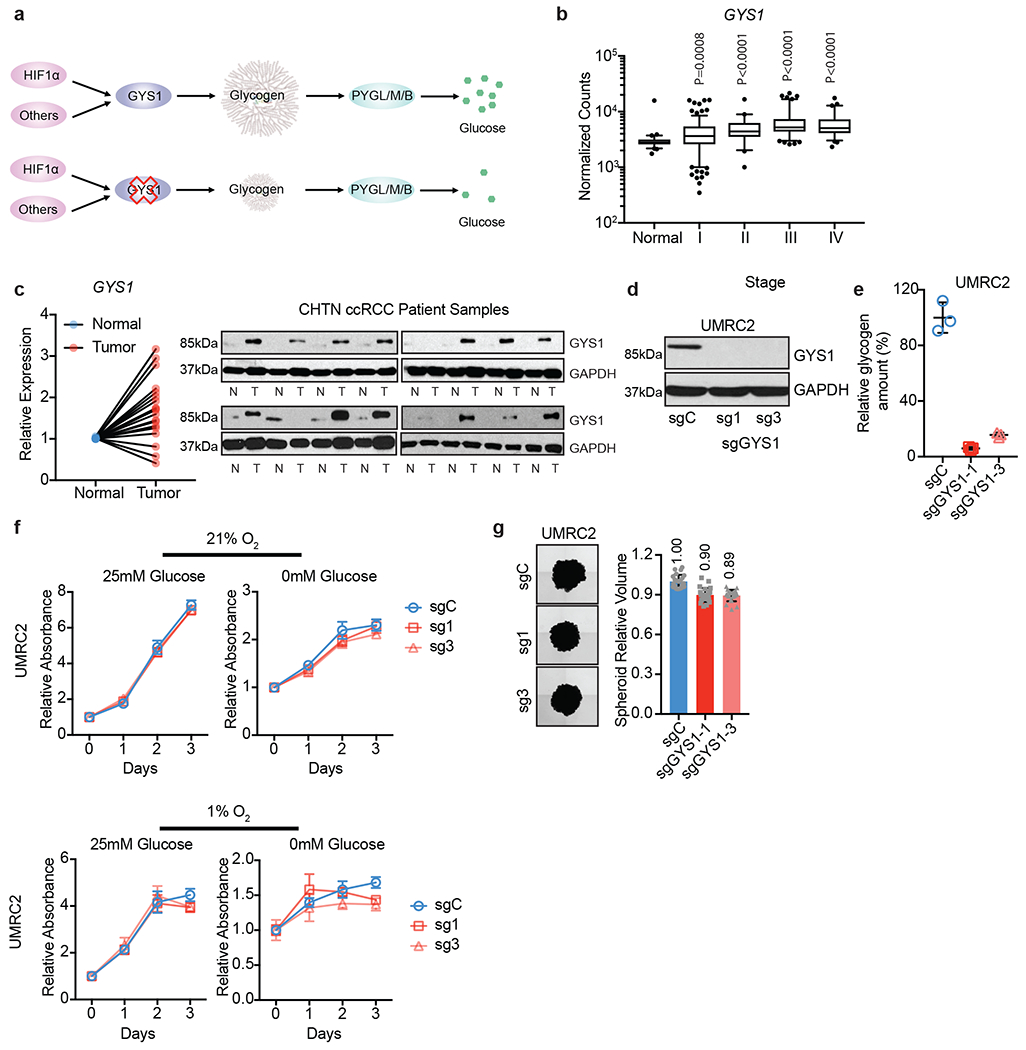
Figure 2. Elevated glycogen synthesis enzyme, GYS1, in ccRCC tumors does not affect proliferation in vitro.

a. Schematic model of simplified glycogen metabolism pathway and hypothetical effect of GYS1 blockade on glycogen and free glucose. b. Normalized RNA-seq reads of GYS1 in stage-stratified ccRCC (n=428) and normal kidney (n=66) samples; n denotes biologically independent human tissue samples. RNA-seq data obtained from TCGA. Box plots (min. to max. all points): center=median, bounds=25th and 75th percentiles, whiskers=5th and 95th percentiles. Center line=median. c. qRT-PCR (left) and immunoblots (right) of GYS1 in matched ccRCC and normal kidney samples; n=20 biologically independent human ccRCC tumor/normal paired samples. For qRT-PCR, TBP and ACTB utilized as endogenous control genes. Relative mRNA expression determined by normalizing to expression in normal tissues. d. UMRC2 ccRCC cells transduced with two independent sgRNAs against GYS1 (sg1 and sg3) or a control sgRNA (sgC). Western blot analysis performed 7 days after virus infection to assess GYS1 expression. e. Glycogen content measured in cells described in d on day 14 after virus infection; n=3 technical replicates as an example of reproducible experiments. Data presented as mean +/− SD. Relative glycogen amount determined by normalizing to glycogen level in sgC cells. f. Growth curves for cells described in d cultured in medium containing 1% FBS combined with indicated glucose and oxygen concentrations; n=6 biologically independent cell populations. Data presented as mean +/− SEM. Relative absorbance determined by normalizing to values at Day 0. g. Representative images acquired at 40X magnification and relative volumes of spheroids formed by cells described in d after 19 days culture; n=24 biologically independent spheroids. Data presented as mean +/− SEM. Relative volume determined by normalizing to that of sgC spheroids. Numbers denote average relative volumes. P values determined by two-tailed Student’s t test. For panels f and g, data are presented as mean values +/− SEM.
