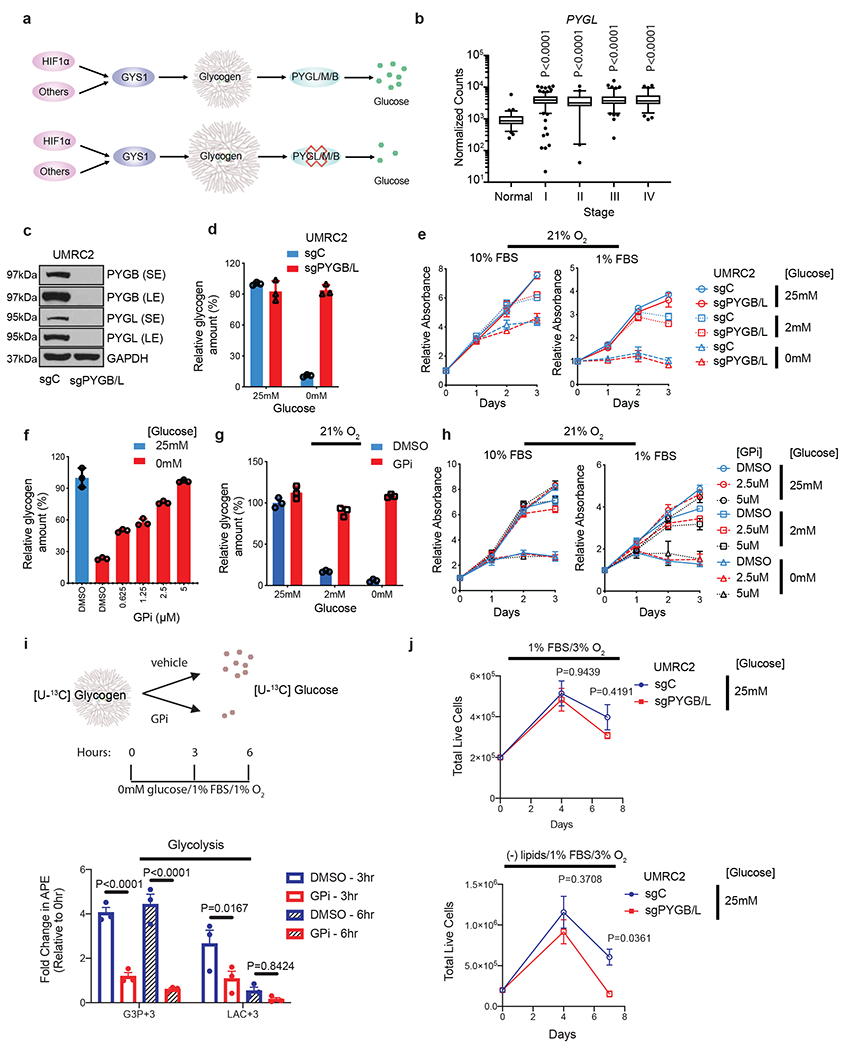
Figure 3. ccRCC tumor cells do not rely on glycogen breakdown for growth in vitro despite glycolytic entry of glycogen-derived glucose.

a. Hypothetical effect of PYGL/M/B blockade on glycogen breakdown. b. Normalized TCGA RNA-seq reads of PYGL in stage-stratified ccRCC (n=428 tumors) and normal kidney (n=66 tissue) samples. P values determined by two-tailed Student’s t test. c. Protein assessment comparing WT UMRC2 cells and PYGL KO UMRC2 cells described in Extended Data Figure 4b transduced with a control sgRNA against LacZ (sgC) or combined two sgRNAs targeting PYGB (sgPYGB/L), respectively. SE, short exposure; LE, long exposure. d. Glycogen quantification of cells described in c cultured in 25mM or 0mM glucose for 6 hours. Normalized to sgC in 25mM glucose. e. Growth curves for cells described in c cultured in indicated conditions; n=6. Normalized to Day 0. f. Glycogen quantification of UMRC2 cells cultured in 25mM (blue) or 0mM (red) glucose, treated with indicated concentrations of DMSO or GPi for 6 hours. Normalized to 25mM glucose. g. Glycogen quantification of UMRC2 cells cultured in 25mM, 2mM, or 0mM glucose and treated with DMSO (blue) or 5μM GPi (red) in 21% O2 for 48 hours. Normalized to 25mM glucose condition plus DMSO. h. Growth curves for UMRC2 parental cells treated with DMSO, 2.5μM, or 5μM GPi and cultured in indicated conditions; n=6 biologically independent cell populations. Normalized to Day 0. i. Upper panel: schematic of uniformly 13C-labeled ([U-13C]) glucose release from glycogen. Bottom panel: fold change in atomic percent excess (APE) of key glycolytic metabolites. Normalized to 0 hr; n=3. G3P+3: Glyceraldehyde-3-phosphate with three 13C carbons. LAC+3: Lactate with three 13C carbons. GPi concentration was 10μM (bottom panel). j. Growth curves for UMRC2 under the indicated culture conditions; n=3 biologically independent cell populations. For I and J, two-way ANOVA with Sidak’s multiple comparison test was used to determine significance. For all glycogen measurements, data from n=3 technical replicates and presented as mean +/− SD. For all growth curves, data from biologically independent cell populations and presented as mean +/− SEM.
