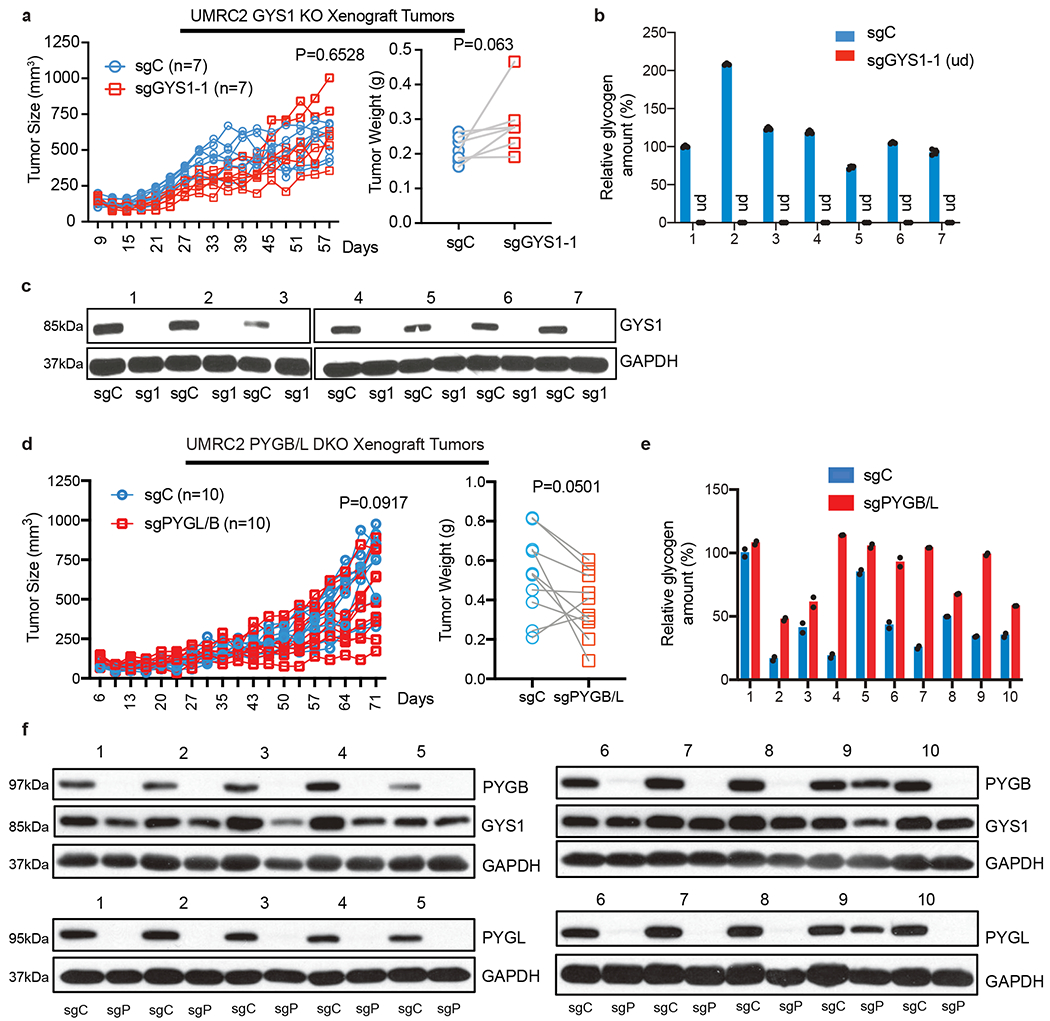
Figure 4. Genetic perturbation in glycogen metabolism does not alter ccRCC xenograft progression in vivo.

a. Tumor volume measurements for UMRC2 control (sgC) and GYS1 KO (sg1) subcutaneous xenograft tumors (in opposing flanks of each animal) at indicated time points (left); n=7 biologically independent tumors. Tumor weights at harvest determined (right). Note: some points overlap. b. Glycogen quantification of 7 pairs of sgC and sg1 xenograft tumors at harvest; n=3 technical replicates per tumor sample. Relative glycogen amount determined by normalizing to glycogen level in #1 sgC tumor. c. Western blot analysis for GYS1 in xenograft tumors. d. Tumor volume measurements for UMRC2 control (sgC) and PYGL/B KO (sgPYGL/B) subcutaneous xenograft tumors (in opposing flanks of each animal) at indicated time points (left); n=10 biologically independent tumors. Tumor weights at harvest determined (right). Note: some points overlap. e. Glycogen quantification of 10 pairs of sgC and sgPYGL/B xenograft tumors at harvest; n=2 technical replicates per tumor sample. Relative glycogen amount determined by normalizing to glycogen level in #1 sgC tumor. f. Western blot analysis for PYGL and PYGB protein in xenograft tumors. sgC: UMRC2 control sgLacZ; sgP: UMRC2 sgPYGB/L. For tumor volume and weight measurements, two-way ANOVA with Sidak’s multiple comparison test and paired t test were used to determine significance, respectively. For all glycogen measurements, data are presented as mean +/− SD.
