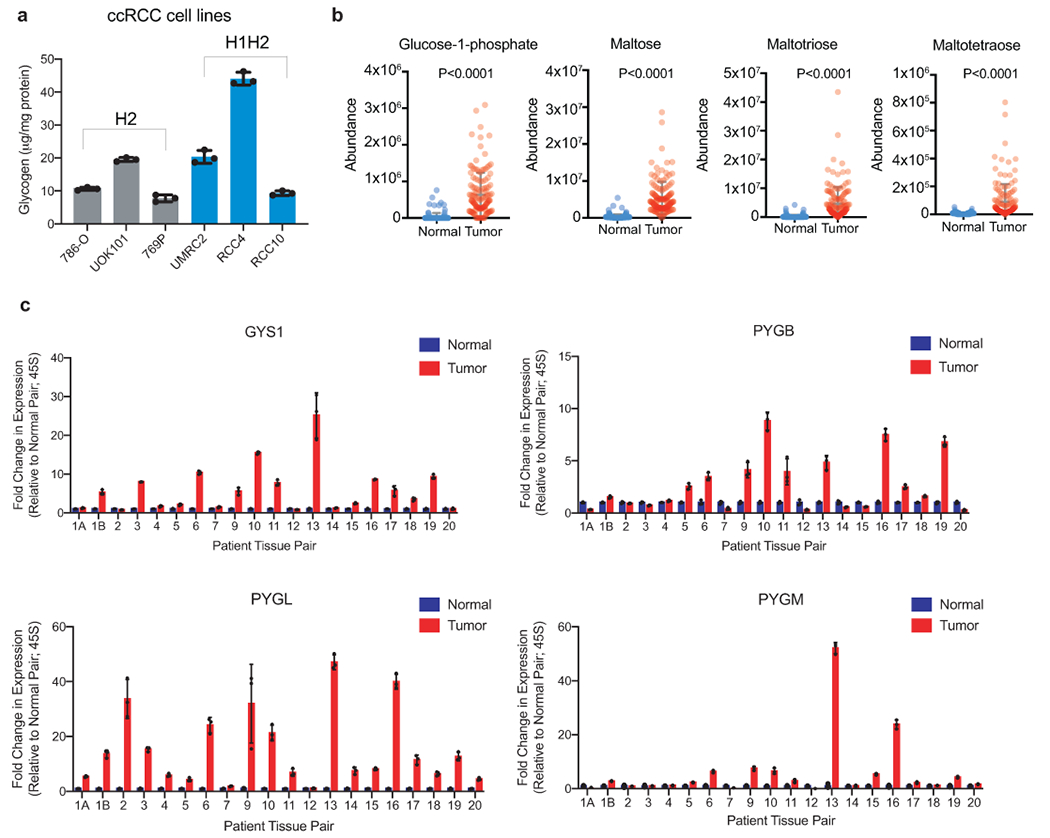
Extended Data Figure 1. (related to Figure 1). Glycogen synthesis and breakdown are hyperactive in ccRCC tumors.

a. Glycogen quantification of six ccRCC cell lines in replete conditions (10% FBS, 25mM glucose DMEM) normalized to protein mass; n=3 technical replicates as an example of reproducible experiments. Data presented as mean +/− SD. “H2”: cell lines exclusively expressing HIF-2α. “H1H2”: cell lines expressing both HIF-1α and HIF-2α. b. Abundance of glycogen metabolism-related metabolites (glucose-1-phosphate, maltose, maltotriose, and maltotetraose) in n=138 biologically independent human ccRCC tumor/normal paired samples; data extracted from Hakimi AA, et al16. Data presented as mean +/− SEM. c. qRT-PCR of GYS1, PYGB, PYGL, and PYGM in 20 matched ccRCC and adjacent normal kidney tissues; n=3 technical replicates per tissue sample as an example of reproducible experiments. Data presented as mean +/− SD. Ribosomal subunit 45S RNA (45S) utilized as the endogenous control gene. P values determined by two-tailed Student’s t test.
