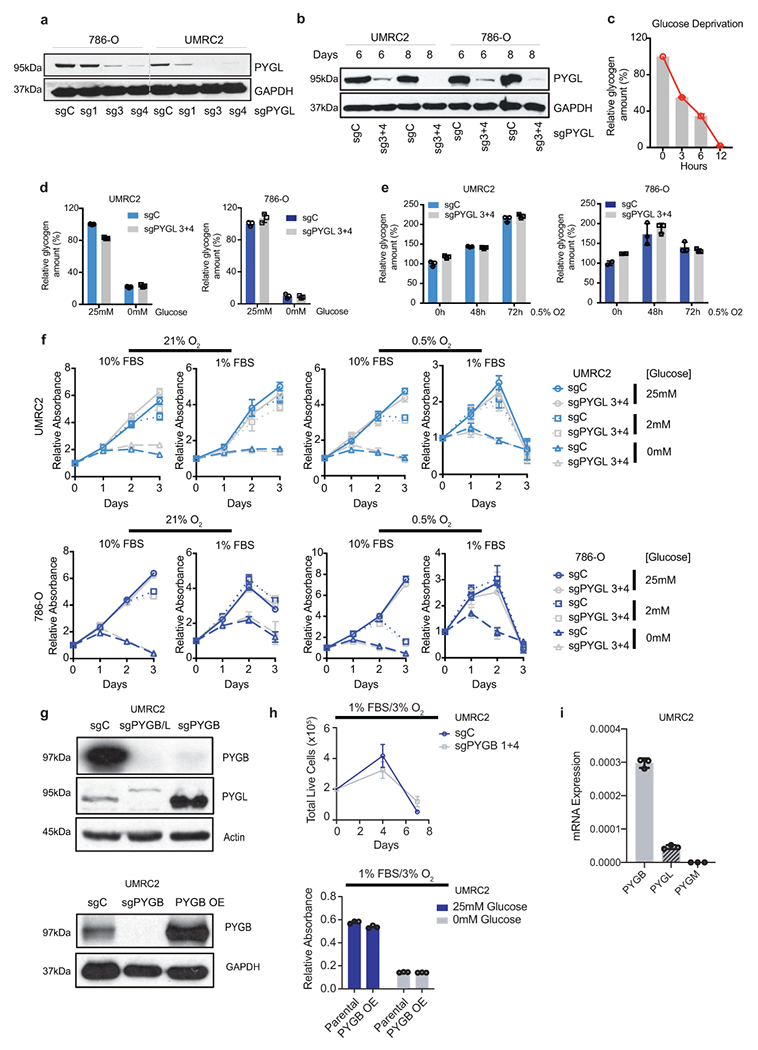
Extended Data Figure 4. (related to Figure 3). PYGL is not required for glycogen breakdown and in vitro ccRCC cell growth.

a, b. Protein assessment of 786-O and UMRC2 ccRCC cells transduced with three independent or two pooled sgRNAs against PYGL (sg1, sg3, sg4, or sg3+4) or a control sgRNA (sgC). Samples collected at 7 (a) or 6,8 (b) days after lentiviral infection. c. UMRC2 cells cultured in glucose-free medium for indicated time points, glycogen extracted and quantified. Relative glycogen amount determined by normalizing to glycogen level in cells at 0 hour. c. Cells described in b cultured in medium with 25mM glucose or starved in glucose-free medium for 6 hours, glycogen extracted and quantified. Relative glycogen amount determined by normalizing to glycogen level in sgC cells cultured in medium with 25mM glucose. e. Cells described in b cultured in 0.5% O2 for indicated time points, glycogen extracted and quantified. Relative glycogen amount determined by normalizing to glycogen level in sgC cells cultured in 21% O2. f. Growth curves for cells described in b cultured in indicated conditions; n=6 biologically independent cell populations. Relative absorbance determined by normalizing to values at Day 0. g. Protein assessment of pooled sgRNAs 1+4 targeting PYGB (sgPYGB) or overexpression of PYGB (PYGB OE), upper and bottom panels respectively. sgC: control (guide targeting LacZ); sgPYGB/L: double knockout. h. Growth assays of UMRC2 under the indicated conditions. Live cell numbers were measured by Trypan Blue exclusion, and finalized values adjusted for dilution; n=3 biologically independent cell populations. PYGB knockout and PYGB overexpression (upper and bottom panels respectively). Parental refers to uninfected UMRC2 cells. I. qRT-PCR on UMRC2 cells for glycogen phosphorylase isoforms; n=3 technical replicates. Data presented as mean +/−SD. Ribosomal subunit 45S RNA (45S) utilized as the endogenous control gene. For all glycogen measurements, data from n=3 technical replicates and presented as mean +/− SD. For all growth curves, data are presented as mean +/− SEM.
