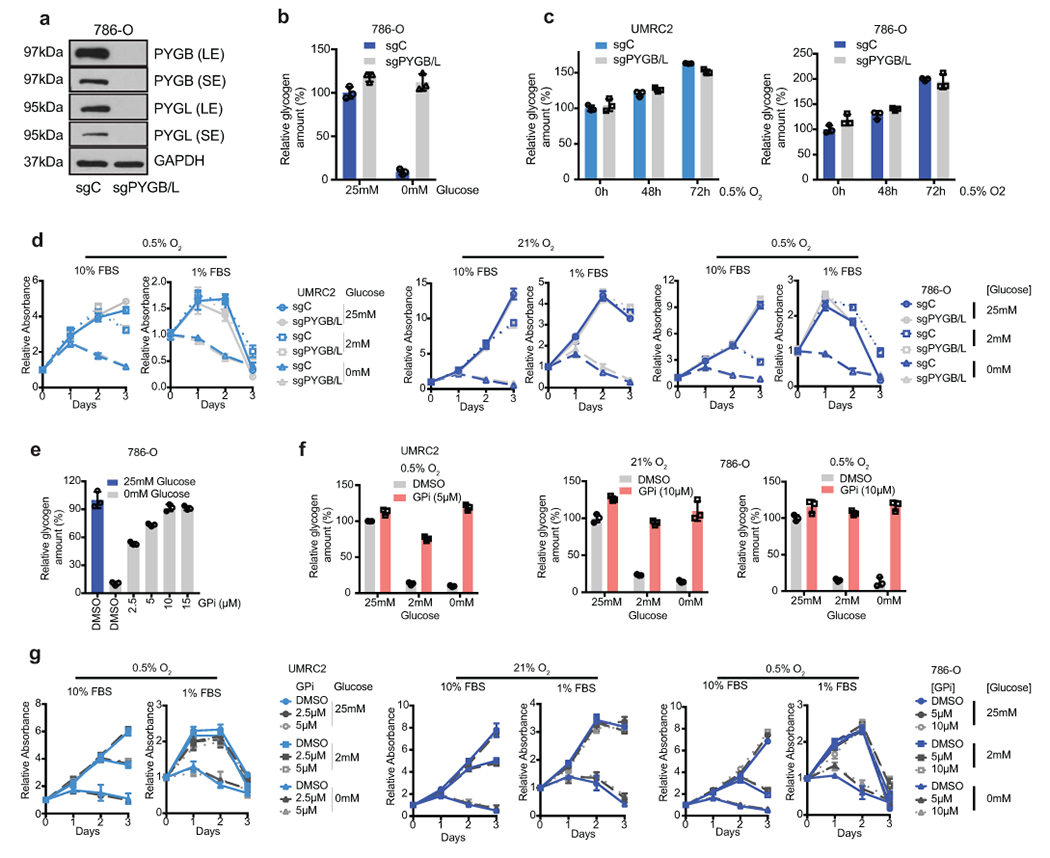
Extended Data Figure 5. (related to Figure 3). ccRCC tumor cells do not rely on glycogen breakdown for growth.

a. WT and PYGL KO 786-O cells transduced with a control sgRNA against LacZ (sgC) or combined two sgRNAs targeting PYGB (sgPYGB/L), respectively. Top 50% GFP positive cells sorted for culture. Western blot analysis performed 14 days after virus infection to assess PYGL and PYGB expression. SE, short exposure; LE, long exposure. b. Cells described in a cultured in medium with 25mM glucose or starved in glucose-free medium for 6 hours, glycogen extracted and quantified. Relative glycogen amount determined by normalizing to glycogen level in sgC cells cultured in medium with 25mM glucose. c. UMRC2 and 786-O sgC vs. sgPYGL/B ccRCC cells cultured in 0.5% O2 for indicated time points, glycogen extracted and quantified. Relative glycogen amount determined by normalizing to glycogen level in sgC cells cultured in 21% O2. d. Growth curves for UMRC2 cells described in Figure 3c and 786-O cells described in a cultured in indicated conditions. Relative absorbance determined by normalizing to values at Day 0. e. 786-O cells cultured in medium with 25mM or 0mM glucose, treated with indicated concentrations of DMSO or GPi for 6 hours. Glycogen extracted and quantified. Relative glycogen amount determined by normalizing to glycogen level in cells cultured in 25mM glucose condition. f. UMRC2 and 786-O cells cultured in medium with 25mM, 2mM, or 0mM glucose, treated with DMSO or 10μM GPi in 21% O2 or 0.5% O2 for 48 hours. Glycogen extracted and quantified. Relative glycogen amount determined by normalizing to glycogen level in cells cultured in 25mM glucose condition treated with DMSO. g. Growth curves for UMRC2 and 786-O parental cells treated with DMSO, 5μM, or 10μM GPi and cultured in indicated conditions. Relative absorbance determined by normalizing to values at Day 0. For all glycogen measurements, data from n=3 technical replicates and presented as mean +/− SD. For all growth curves, data from n=6 biologically independent cell populations and presented as mean +/− SEM.
