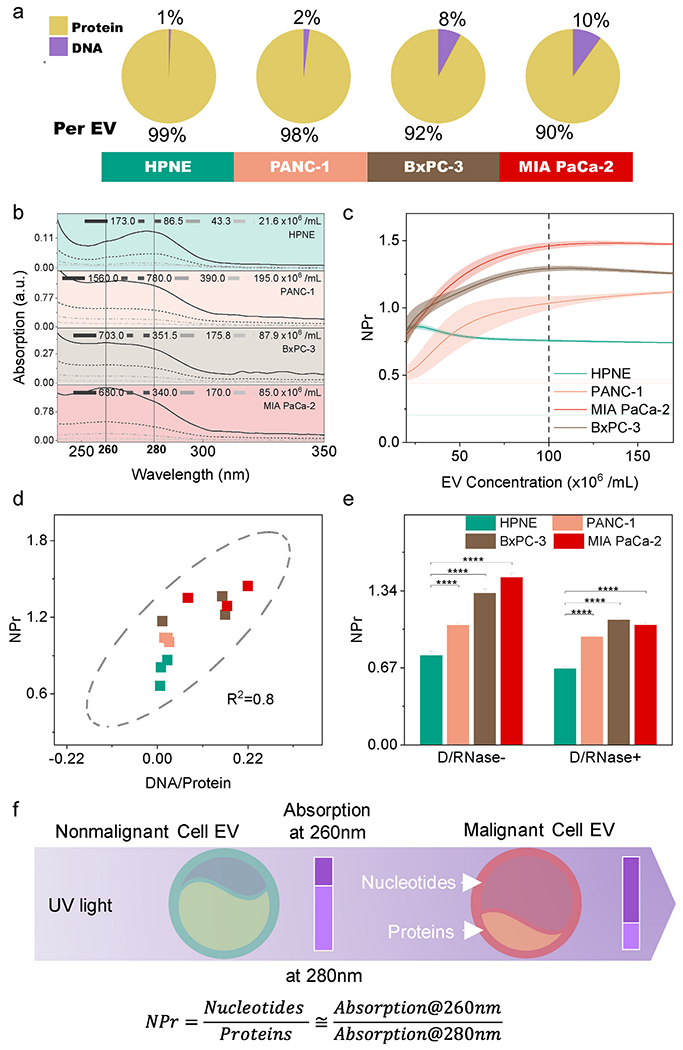
Fig. 1. EV NPr values distinguish EVs of malignant and non-malignant cells of the same lineage.

(a) DNA and protein composition of isolated EVs (n = 3/group). (b) The absorption spectrum of diluted EVs. The spectrum is EV concentration-dependent. (c) Mean (solid line) and SE (shaded area) of NPr values relative to EV concentration (n = 5/group). Cell-specific EV NPr proximate to constant when EV concentration > 108/mL. (d) Correlation of EV DNA/Protein mass ratio and NPr values, which is the rationale to use NPr for relative EV nucleotide quantification. (e) NPr values detected with and without DNase/RNase treatment to remove extravesicular nucleic acids (n = 5/group). Extra-EV nucleotides contamination does not mask out EV NPr difference between malignant and non-malignant cells. (f) Scheme of spectrophotometric NPr value for EV discrimination. Data points represent mean ± SE.
