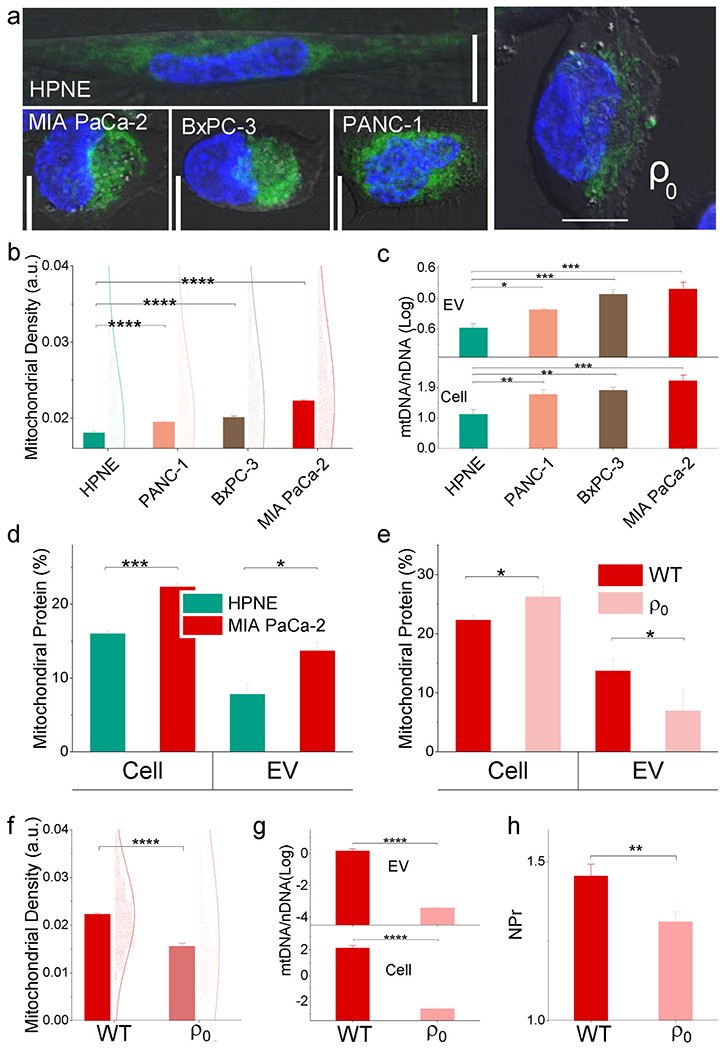
Fig. 2. Mitochondrial effects on EV composition and NPr.

(a) Representative confocal images depicting mitochondria (green) and nuclei (blue) in the indicated cell types. Scale bar: 10 μm. The malignant cell is mitochondrial rich compared to the non-malignant cell. Wild type (WT) MIA PaCa-2 cell is mitochondrial rich compared to mitochondrial DNA depleted cells (ρ0). (b) and (f) Flow cytometry analysis of mitochondrial density normalized by cell size. (c) and (g) mtDNA/nDNA ratio and (d) and (e) mitochondrial protein composition of HPNE and MIA PaCa-2 cells and their EVs. (h) NPr comparison between WT and ρ0. Mitochondrial DNA contributes to EV NPr of malignant cells (mean ± SE; n = 4/group). (For interpretation of the references to colour in this figure legend, the reader is referred to the Web version of this article.)
