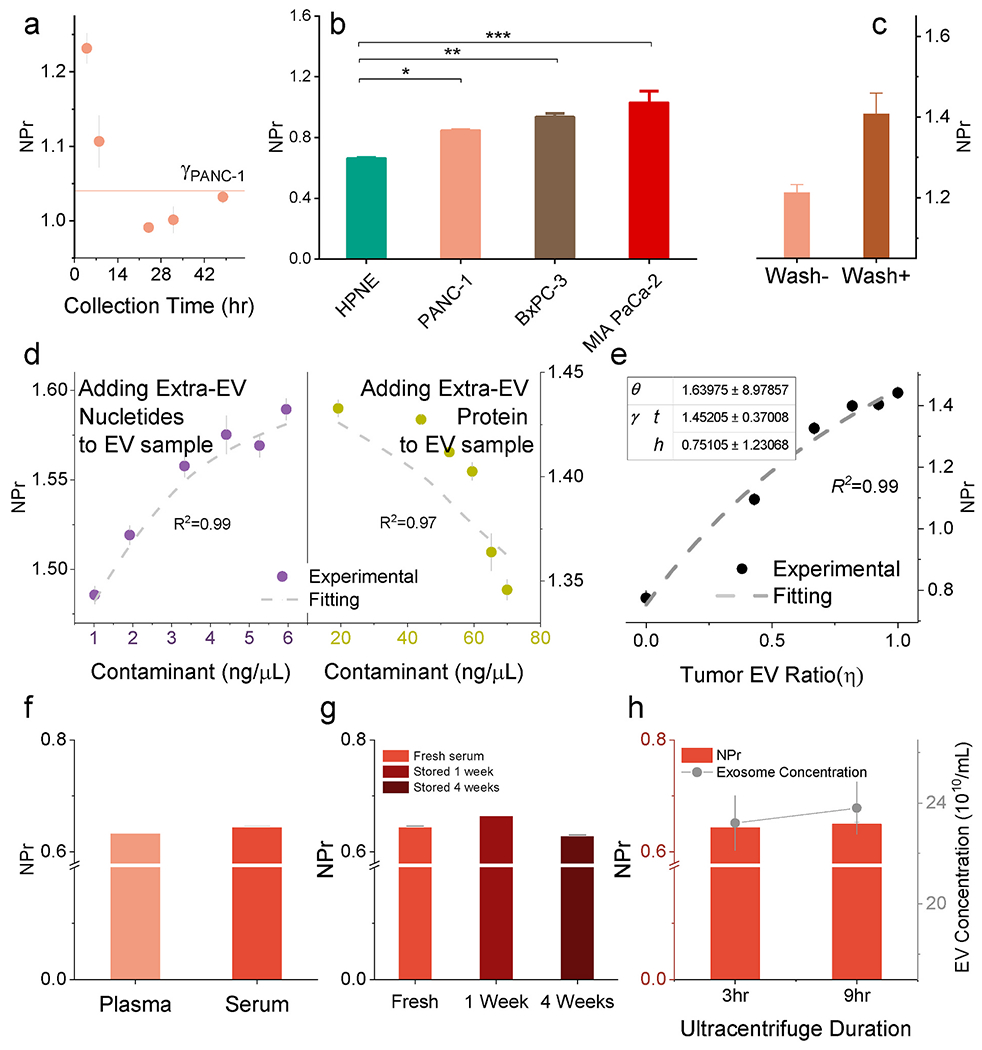
Fig. 3. NPr as a measure of EV purity.

(a) The collection condition affects EV NPr value. PANC-1 NPr decreased in relation to starvation time. (b) NPr difference between malignant and non-malignant EV was not masked out by changing the collection condition. NPr values of EVs isolated from cells maintained under nonstarvation conditions (n = 5). (c) NPr values were increased by wash steps corresponding to reduced protein contamination. (d) EV NPr affected by adding contaminants (nucleotides and protein) following the nonlinear model as reflected by Alber’s law (Supporting Information). (e) NPr reflected the relative abundance of MIA PaCa-2 EVs in mixed EV samples containing MIA PaCa-2 and HPNE EVs. NPr indicates the relative purity of a specific EV population in a mix. (f) NPr values of EVs purified from healthy human serum and plasma. (n = 6). (g) Stability of NPr values in relation to storage time at 4 °C for weeks (n = 5). (h) NPr values in response to ultracentrifugation time during EV isolation (n = 5). Increasing ultracentrifugation time escalated EV yield but not NPr. Data points represent mean ± SE.
