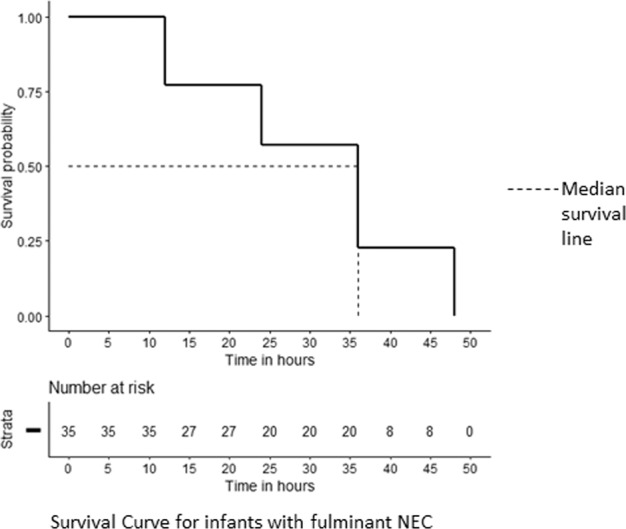
Fig. 1. Kaplan–Meier curve (survival curve) showing mortality in neonates with fulminant necrotizing enterocolitis.

The dotted line represents the median survival line. X-axis represents the time in h. The numerical 0 on the X-axis represents the time of NEC onset. Y-axis represents the survival probablity.
