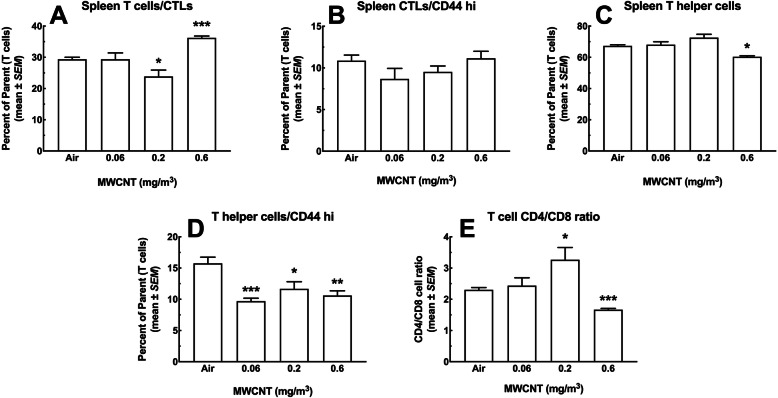
Fig. 11.
T cell subtypes in the spleen following 30-day MWCNT exposure + 10 days recovery. a CD8+ cytotoxic T lymphocytes (CTL) as a percent of total T cells (CD3+ lymphocytes). Asterisks *** indicate significance at P < 0.001 compared to all other groups or * P < 0.05 compared to air control group. b Activated cytotoxic T lymphocytes expressing high levels of CD44 as a percent of total T cells. c CD4+ T helper cells as a percent of total T cells. Asterisk * indicate significance at P < 0.05 compared to all other groups. d Activated T helper cells expressing high CD44 as a percent of total T cells. Asterisks *** P < 0.001, ** P < 0.01 or *P < 0.05 compared to Air control group. e Ratio of CD4+ to CD8+ T cells. Asterisks *** indicate significance at P < 0.001 compared to all other groups or * P < 0.05 compared to air control group. All data expressed as mean ± SEM (n = 8)

