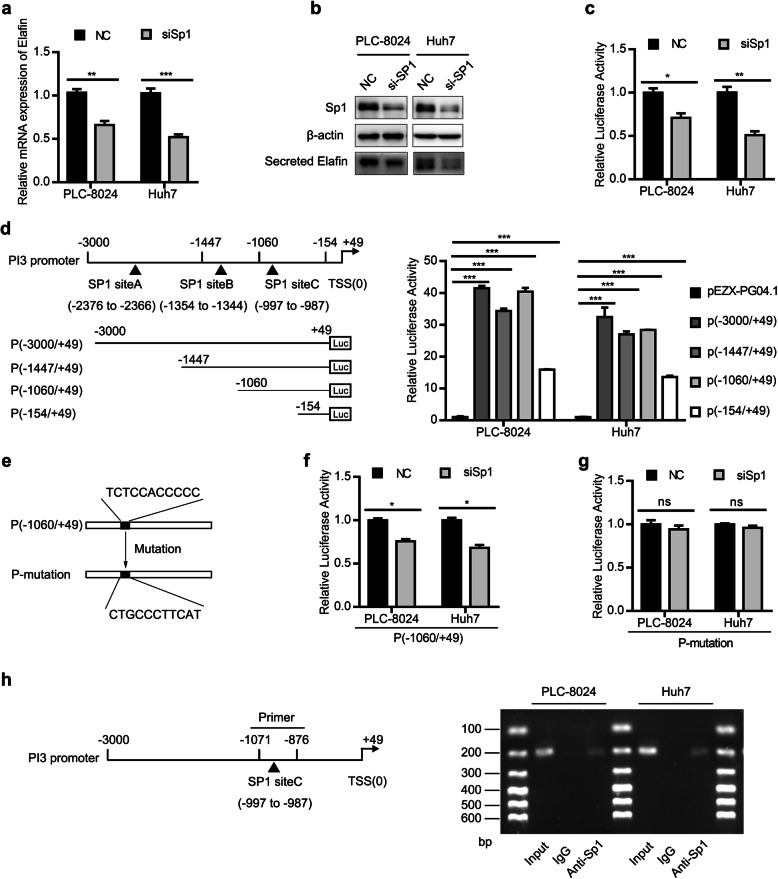
Fig. 6.
Sp1 regulates Elafin expression by activating Elafin promoter. a and b Sp1 decreased Elafin expression in HCC cells. Real-time PCR assay (a) and western blotting assay (b) were performed to detect Sp1 and Elafin expression after transfected with NC or siRNA of Sp1. ** P < 0.01, *** P < 0.001. c Knockdown of Sp1 reduced the Elafin promoter activity. HCC cells were reversely transfected with NC or siSp1 for 24 h, followed by transfection with full-length Elafin promoter (P (− 3000/+ 49) for another 48 h, then were subjected to luciferase activity analysis. * P < 0.05, ** P < 0.01. d Schematic view of the luciferase reporter constructs containing various length of the 5′-flanking regions of the Elafin encoding gene, PI3. Detailed characterization of the PI3 promoter by 5′-deletion and site-specific deletion analyses were performed. HCC cells were transfected with the vector (PEZX-PG04.1) and indicated luciferase reporter constructs for 48 h, then was subjected to luciferase activity analysis. *** P < 0.001. e The sequence of siteC in P (− 1060/+ 49) and the corresponding sequence of mutation in P-mutation are presented. f Knockdown of Sp1 decreases the luciferase activity of P (− 1060/+ 49). HCC cells were reversely transfected with NC or siSp1 for 24 h, followed by transfection with (P (− 1060/+ 49) for another 48 h, then were subjected to luciferase activity analysis. * P < 0.05. g Knockdown of Sp1 do not change the luciferase activity of P-mutation. HCC cells were reversely transfected with NC or siSp1 for 24 h, followed by transfection with P-mutation for another 48 h, then were subjected to luciferase activity analysis. h Sp1 directly bound to the PI3 promoter. Schematic representation of PI3 promoter regions and indicated primers for CHIP assay (left) were conducted and CHIP samples were analyzed by semi-quantitive PCR (right)

