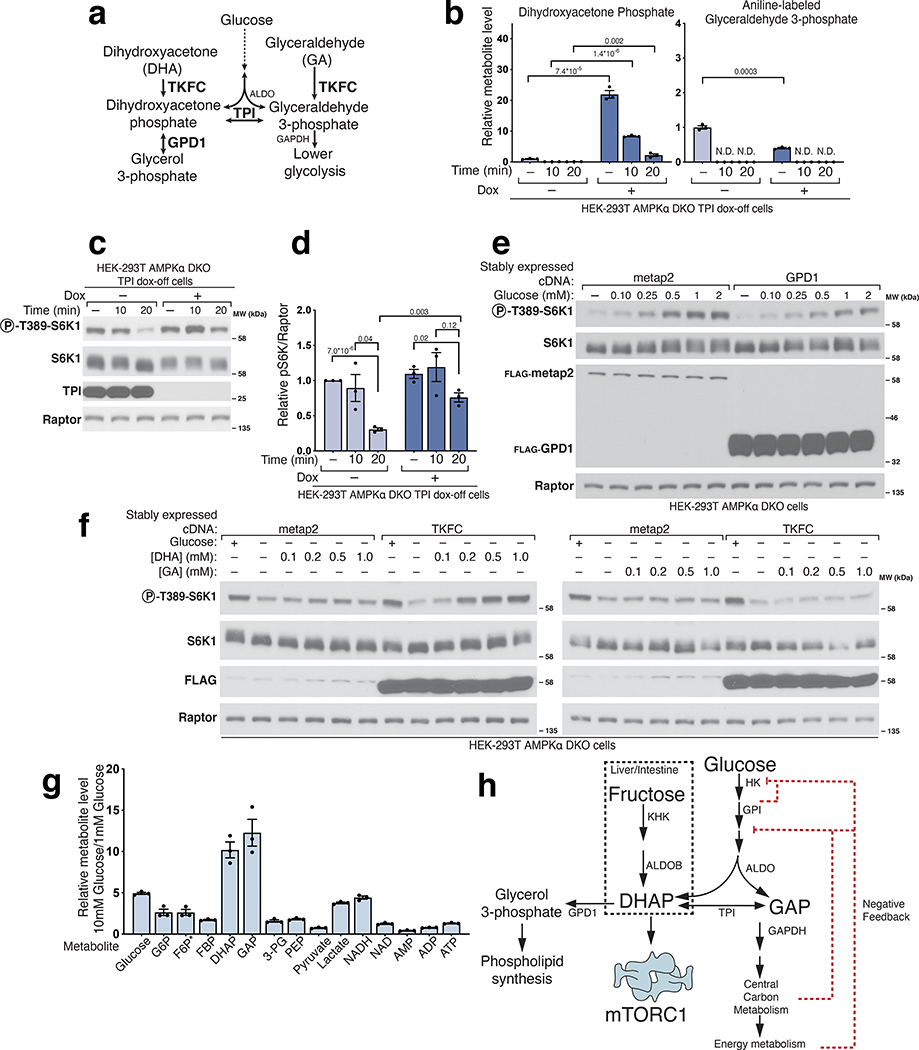
Figure 4. Triose phosphate isomerase (TPI) is downstream of the metabolite that signals glucose availability to mTORC1 and DHAP synthesis is sufficient to activate mTORC1.
a) Model depicting the metabolism of trioses and triose-phosphates. b-d) TPI loss causes supraphysiological levels of dihydroxyacetone phosphate (DHAP) and slower catabolism and slower inhibition of mTORC1 following glucose starvation. The levels of glyceraldehyde 3-phosphate (GAP) are decreased and consumed at a normal rate. AMPKα DKO TPI dox-off HEK-293T cells treated with doxycycline for ten days were starved of glucose for the indicated periods of time. Metabolite extracts were analyzed by LC/MS (b) and protein lysates by immunoblot (c). Data are shown in (b) as mean ± s.e.m. for n = 3 biologically independent replicates. P-values were determined for two-sided Student’s t-tests. N.D., peak not detected. Immunoblots for the phosphorylation state and levels of the indicated proteins (c) were quantified in (d). Data are shown as mean ± s.e.m. for n = 3 biologically independent replicates. P-values were determined for two-sided Student’s t-test. e) Overexpression of GPD1 decreases the activation of mTORC1 by glucose. AMPKα DKO HEK-293T cells expressing the indicated cDNAs were starved of glucose for 3 hours or starved of glucose and re-stimulated with the indicated concentration of glucose for 10 minutes. f) DHAP synthesis is sufficient to activate mTORC1 in the absence of glucose. AMPKα DKO HEK-293T cells stably expressing the control protein FLAG-metap2 or FLAG-TKFC were starved of glucose for 3 hours or starved and stimulated for 10 minutes with glucose or the indicated concentrations of dihydroxyacetone (DHA) or glyceraldehyde (GA). g) The fold-change in DHAP and GAP levels between cells in low (1 mM) and high (10 mM) glucose is greater than that for any other glycolytic metabolite. AMPKα DKO HEK-293T cells were starved of glucose for 3 hours and then restimulated for 15 minutes with either 1 mM glucose or 10 mM glucose. Metabolite extracts were analyzed by LC/MS. Data are shown as mean ± s.e.m. for n = 3 biologically independent replicates. P-values were determined for two-sided Student’s t-test. * The peak used to quantify fructose 6-phosphate (F6P) levels may also contain glucose 1-phosphate. h) Diagram depicting the metabolism of glucose in most cells and of fructose in the liver and intestine.

