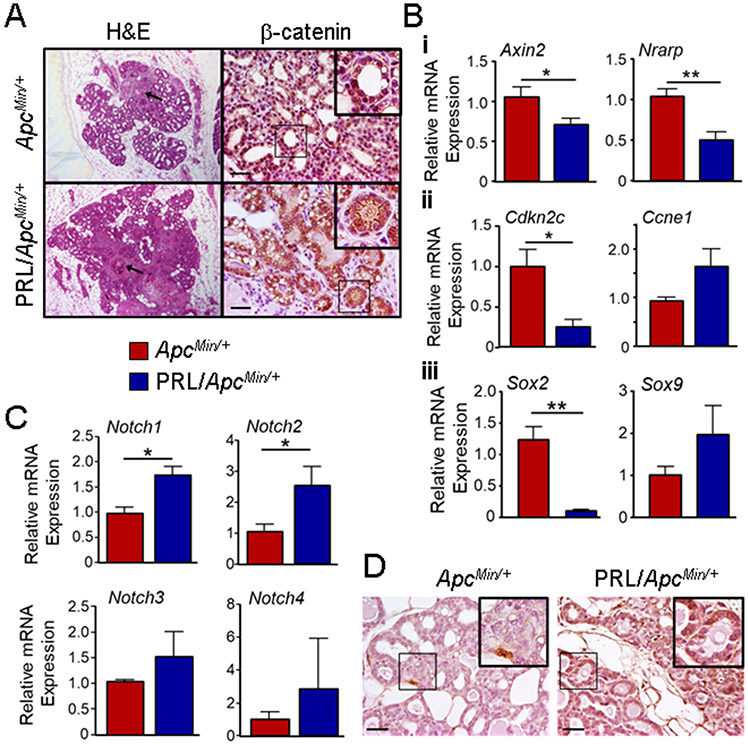
Fig. 4. Large hyperplastic lesions in mammary glands from ENU-treated ApcMin/+ and NRL-PRL/ApcMin/+ females exhibit different localization of β-catenin and expression of Notch receptors, which are associated with different levels of target genes regulating proliferation and cell fate.
(A) Left, representative large hyperplasias from genotypes shown, stained with H&E. Arrows indicate squamous changes. Right, representative immunohistochemistry for β-catenin, showing markedly different localization between these genotypes. Insets as shown. Scale bars, 100μm. Original magnifications, x200. (B) Relative levels of transcripts in mammary epithelial cell preparations were determined by qRT-PCR. (i) indicators of Wnt and Notch signals. (ii) cell cycle regulators. (iii) Sox genes. Mean ± S.E.M., N=3-4. (*, p<0.05; **, p<0.01, unpaired Student’s t test). (C) Relative levels of transcripts for Notch receptors in mammary epithelial cell preparations were determined by qRT-PCR. Mean ± S.E.M., N=3-4. (*, p<0.05; unpaired Student’s t test). (D) Representative immunohistochemistry for NOTCH1, showing strikingly different levels of expression between these genotypes. Insets as shown. Scale bars, 100μm. Original magnifications, x200.

